

Eta Technical Info
Eta: Technical Info
Eta Technical Info
Eta: Technical Info
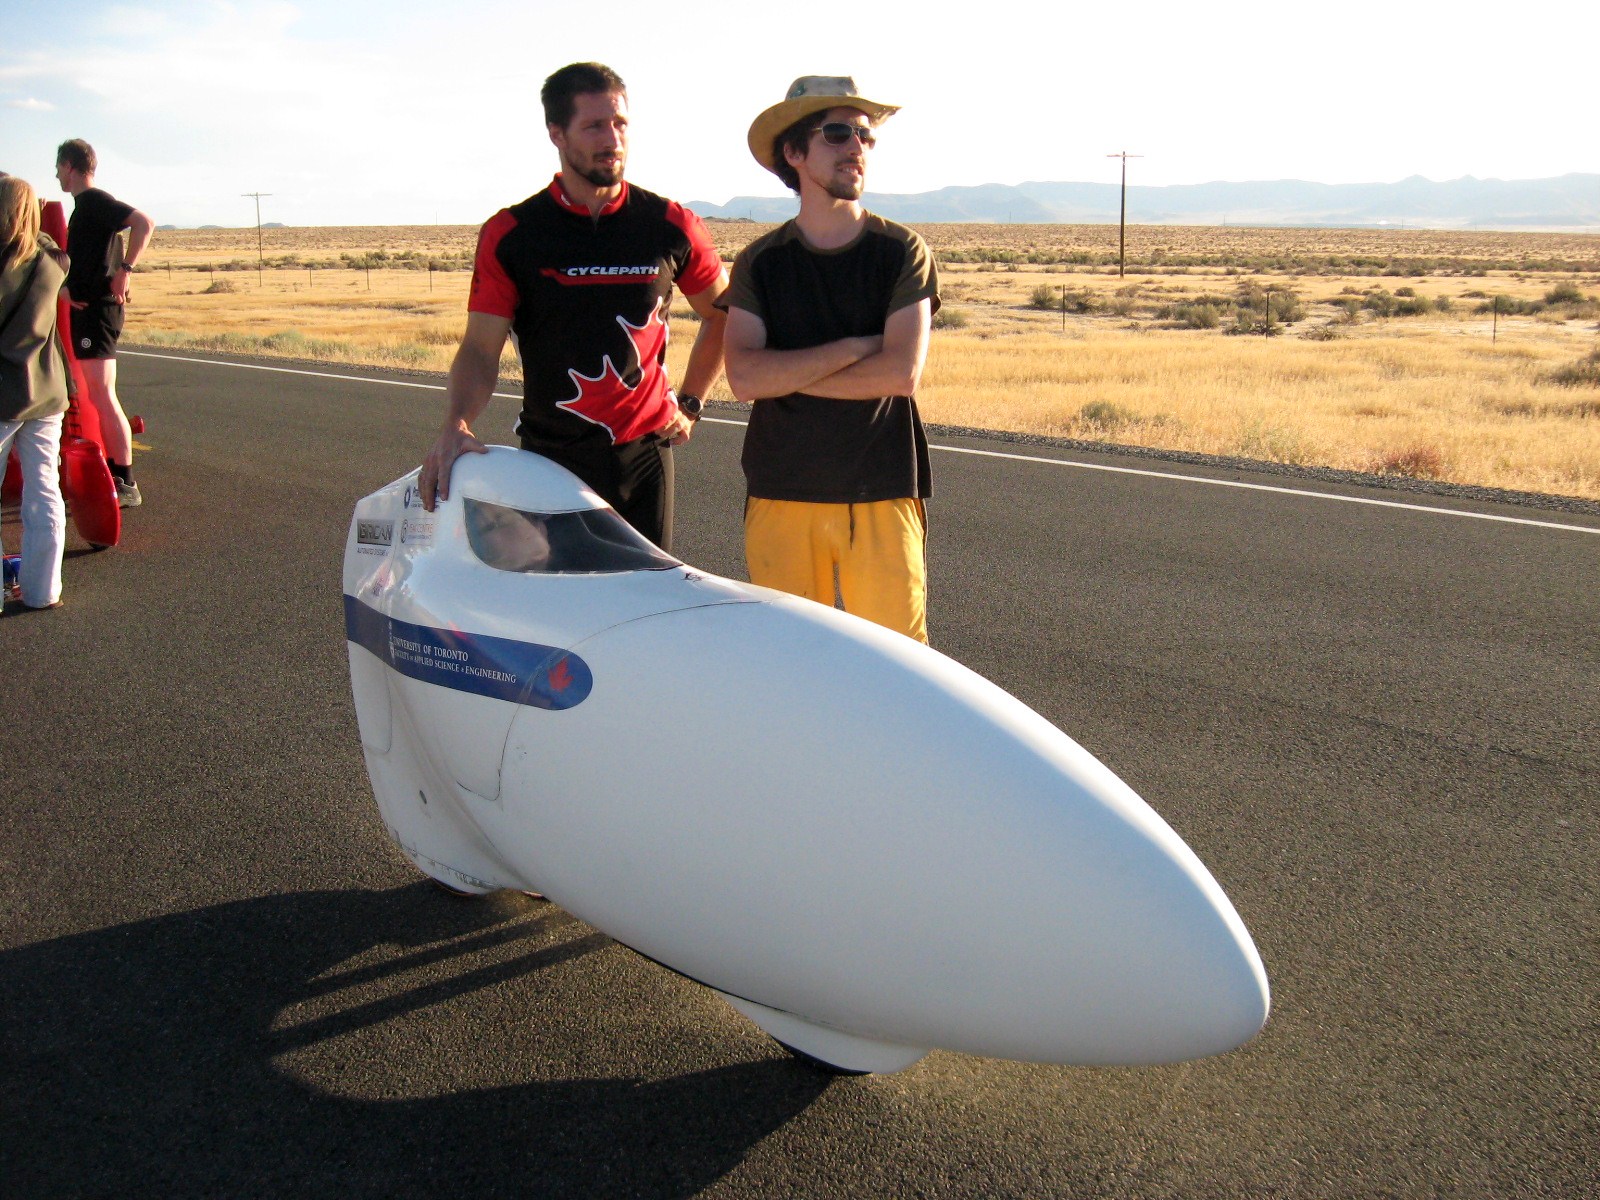
Before starting on Eta, the core Aerovelo team members had built a series of speedbikes as part of the University of Toronto Human-Powered Vehicle Design Team. These bikes were primarily designed for the urban utility challenge of the ASME student competition, but they were also designed with top speed in mind. In 2013, one of these bikes (Bluenose) was used as a research testbed to prepare for the development of Eta. The tests involved the addition of a tail fin to improve handling qualities, on-road aerodynamic testing to correlate our design models with reality, and conversion to a camera-based vision system instead of a large windscreen.

ACE (2010)
Top Speed: 101.85 km/hr
Vortex (2011)
Top Speed: 116.92 km/hr
Bluenose (2012-2013)
Top Speed: 125.02 km/hr
Eta was the first bike built under Aerovelo, and the first bike designed purely for speed. The goal was to combine all of our experience into one bike, and at the same time try to reduce risk by minimizing the number of new ideas that we had never previously tried. Even with this design methodology our first attempt in 2014 was plagued with broken spokes and a variety of other mechanical issues. 2015 was rededicated to small improvements and getting as much road testing as we possibly could.

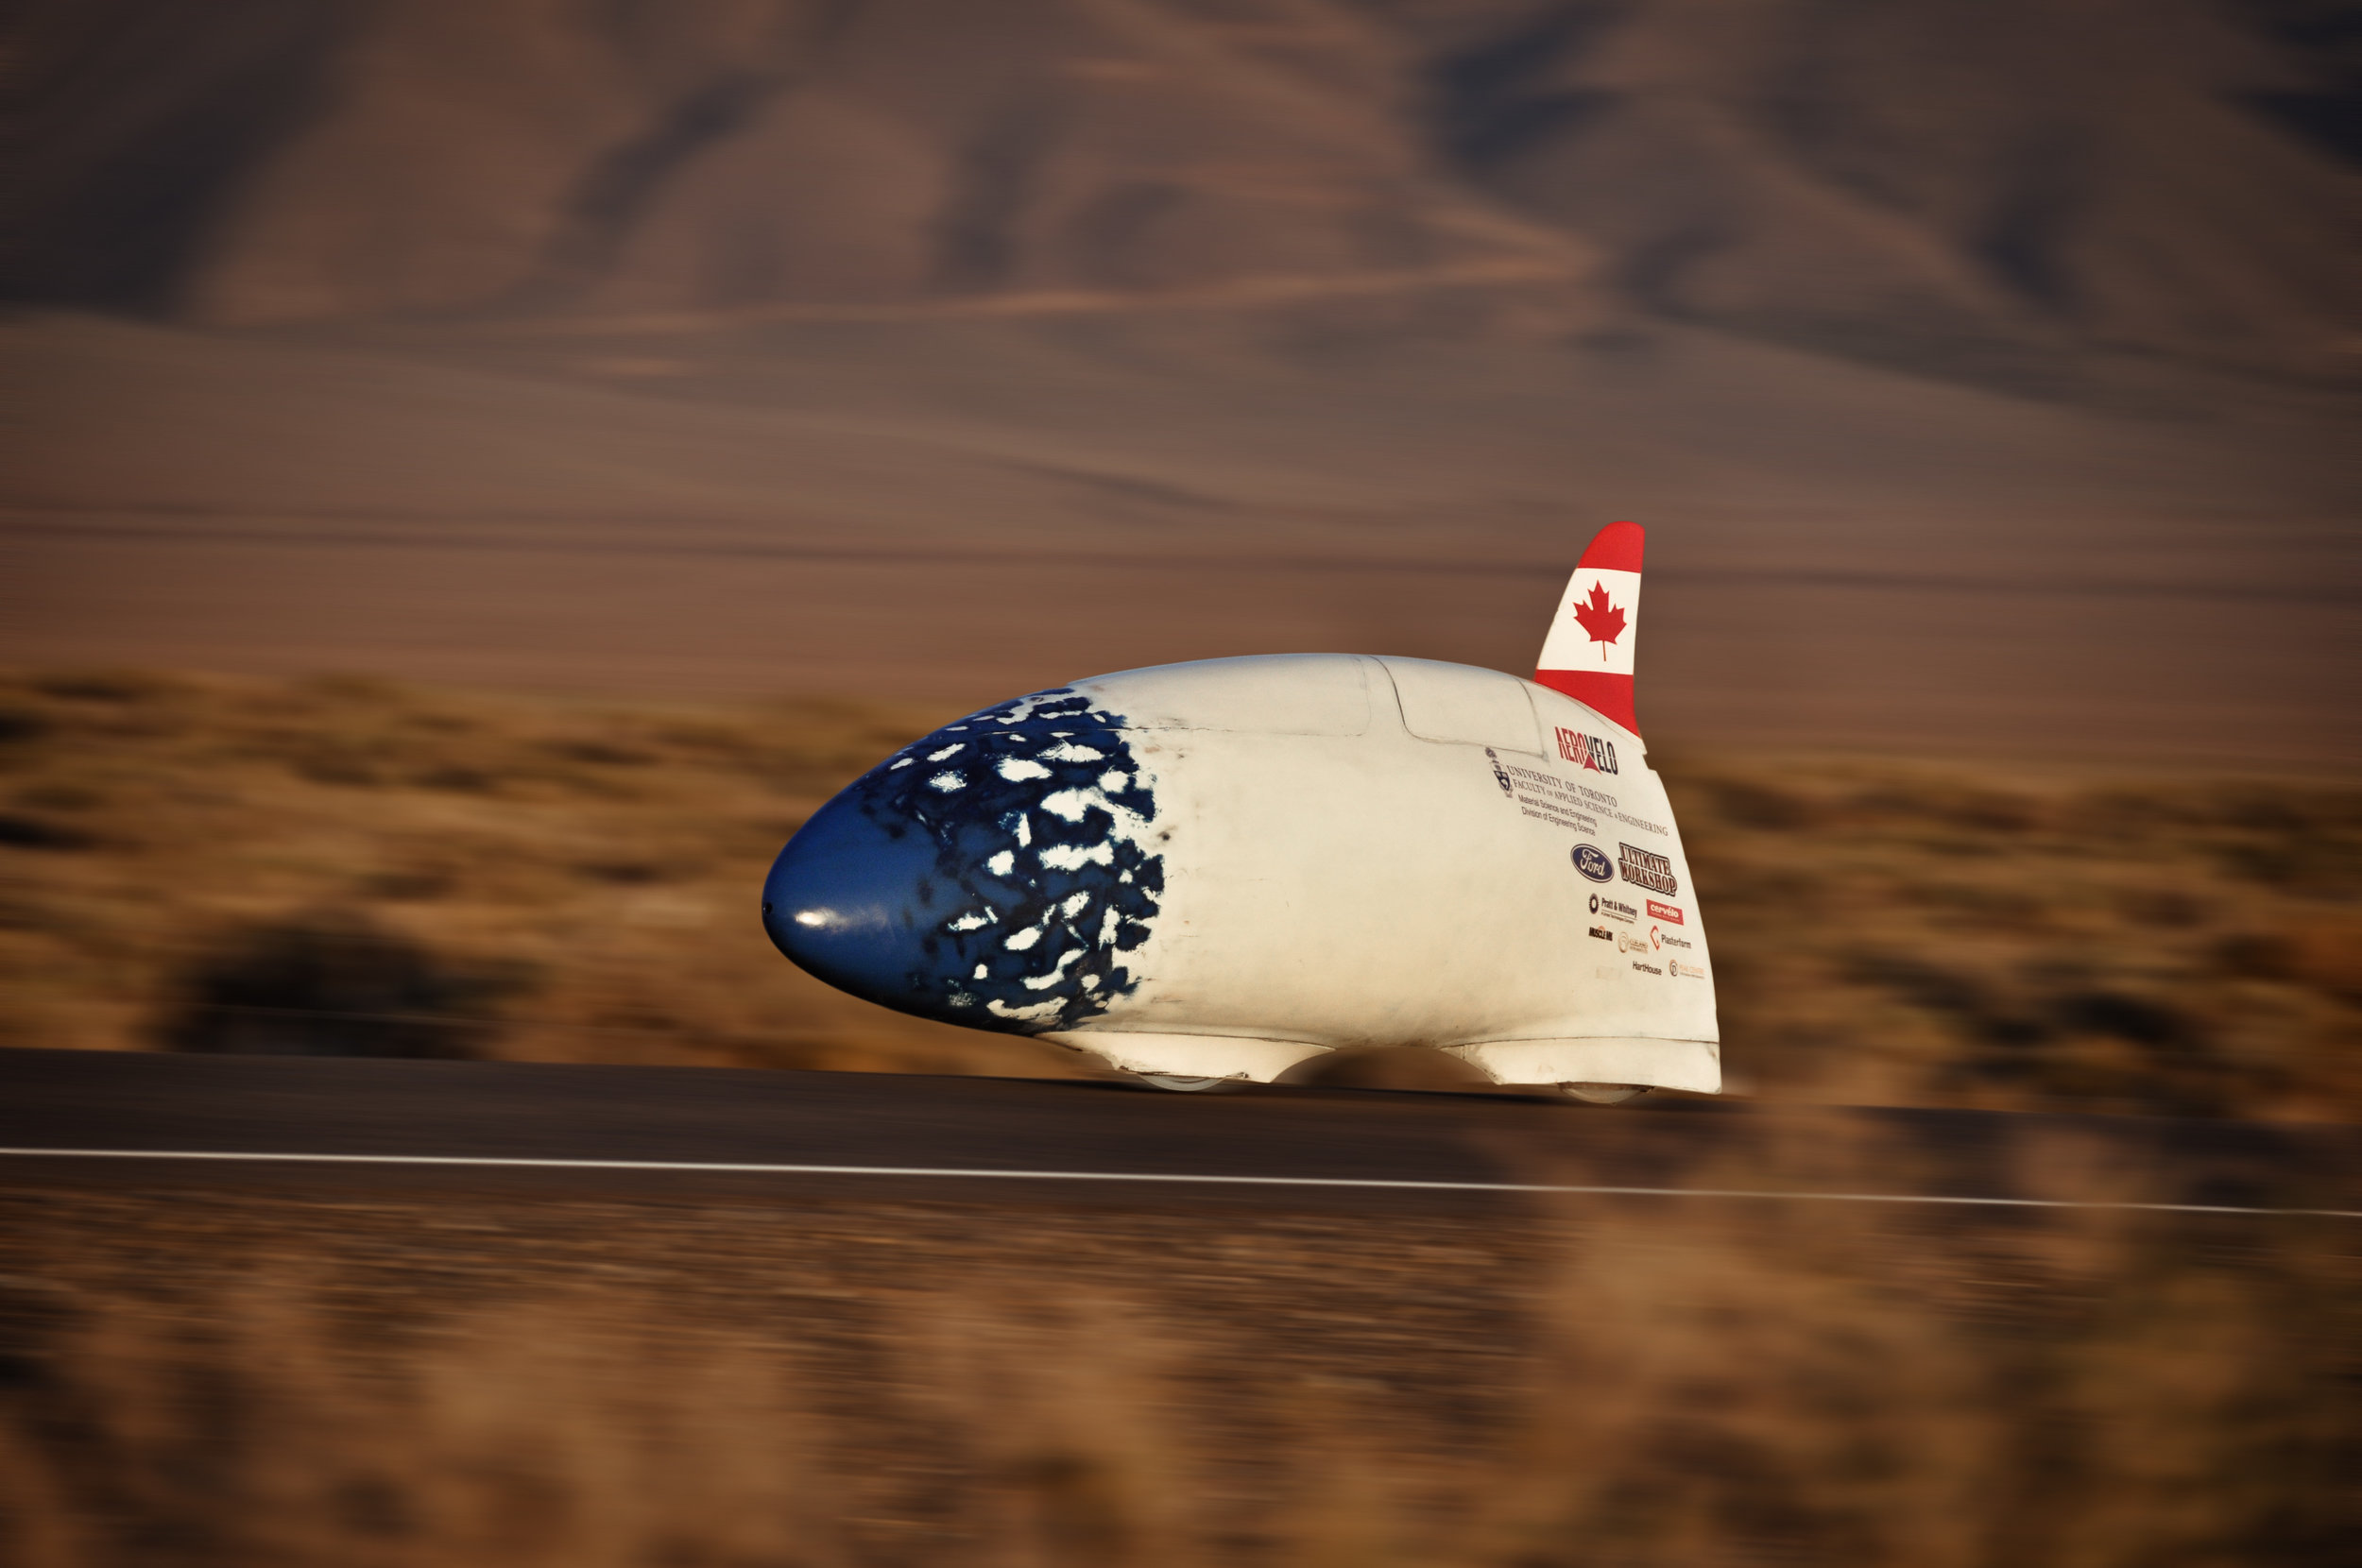
Eta in 2016, showing the laminar front shell with no stickers or seams. (Photo courtesy of Bas de Meijer)
There are several particular features that make Eta fast, but it is truly the way they all fit together that take Eta to the next level. In the end, everything fits into an incredibly small package, with good ergonomics for rider output, excellent handling qualities, large low-rolling-resistance tires and an advanced aerodynamic shape. A few of the particulars are outlined below:
Human Power & Ergonomics: Every bike design starts with a good fitting rig: a seat and pedals that can be used to adjust the position of the rider, test out the ergonomics and then measure the rider envelope with millimetre accuracy. For aerodynamic reasons we want the rider as recumbent as possible, but leaning too far back can reduce the rider's ability to produce power. The effect of small changes in foot height, hip angle and seat angle are measured in lab tests and gained from experience on previous bikes.
Vision System: One of the most surprising features of Eta is that it has no see-though canopy for the rider to see. Instead, the rider looks at two video screens inside the bike, projecting the image from the two cameras above. Two cameras are used just in case one of them stops working at 140+ km/hr. There is also a small onboard micro-computer that shows the rider critical information with an on-screen display. This includes power, cadence, gps speed, distance down course, and target power and speed. The computer is also running an onboard simulator (based on the measured power from the pedals) and displaying the difference between the actual speed and the simulated speed on the screen. This allows the rider to make an informed decision during the run as to whether or not they should go for an all-out sprint, or save their energy for another day when the weather / bike conditions are more favourable.
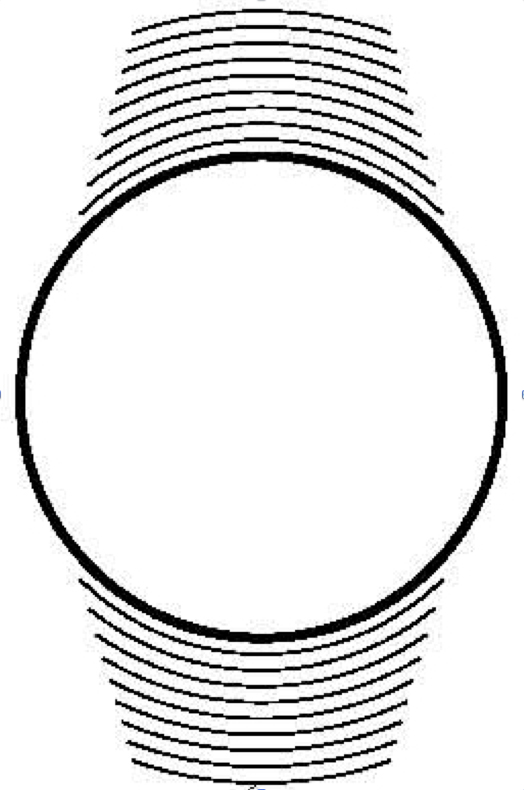
Aerodynamics: When it comes to aerodynamic design, the first thing we need to do is eliminate large-scale flow separation, turning a blunt object (like a golf ball) into a streamlined object (like a fish). The next strategy is to try to minimize the small-scale turbulence, that which exist in the thin layer of air next to the bike called the boundary layer. We design the bike so that any given particle of air follows a very specific pressure profile as it passes by the bike. We do this by iteratively changing the shape and simulating the airflow with a computer model. This pressure profile mimics that of the NACA 6-series airfoils that were developed at NACA (before it became NASA), to achieve extended laminar flow. Even with the right pressure profile, however, it can be extremely difficult to convince the flow to stay laminar, and any disturbances from road vibration, seams in the shell or bugs splattered on the surface will turn the laminar boundary layer turbulent. If we can manage to keep it laminar however, we can cut the drag by more than 50% over a shell that, from the outside, looks very similar.
Rolling Resistance & Wheels: With the aerodynamic drag greatly reduced, the rolling resistance of the tires becomes a major source of power loss. Rolling resistance goes down with increased wheel diameter and tire width, and so, as with almost everything on Eta, it becomes an incredibly tight packaging problem to try to fit the biggest tire in the smallest space. Rolling resistance also goes down when there is less thickness to the rubber that is being deformed by ground contact, so Eta rides on ultra thin (< 2mm) tires.
Drivetrain: The drivetrain is done in two stages: first from a 93 tooth chainring to a custom 7-speed cassette, and then from a 39 tooth chainring to an 18 tooth cog at the front wheel hub. To keep the chain lines as short as possible, Eta is front wheel drive. This innovative system, refined in the speedbike community more than 20 years ago, means that the second chain is connected to a wheel that is also steering. As long as the second chain is parallel to the head tube angle, this system works incredibly well.
For much more detailed technical information on the design and construction of Eta, browse through the Mission Log or various videos on the YouTube Channel.
Atlas Technical Info
Atlas
Technical Information
Atlas Technical Info
Atlas
Technical Information
The crucial rotor design of the Atlas human-powered helicopter was completed by the end of April 2012, and construction began with the full student team in May. The initial configuration study resulted in the selection of a quad-rotor design similar to that of the Yuri I (Japan) and the Gamera (USA) human-powered helicopters. This was based on a lower predicted power requirement, the stability of the configuration, and the ease of construction based on many parts with production-line repeatability.
The rotor optimization was carried out using the in-house computational model outlined below. Further design on the helicopter components and overall structure was done using in-house finite element analysis programs and further computational optimization, as well as empirical design-test processes.
Many changes were made throughout the flight testing process, but the overall size and weight remained nearly the same.
Rotor Radius: 10.2m (33.5ft)
Maximum Dimension: 46.4m (154ft)
Height: 3.7m (12.1ft)
Overall Weight: 55Kg (121.4lb)
Computational Modelling and Design Optimization
The computational model involves a medium-fidelity aerodynamic model, combined with a finite-element structural analysis. Given a set of roughly 30 design variables, including rotor geometry, lift coefficient, spar diameter, and tube thickness the program computes the total mass of the aircraft, the required flight power and the stresses in all the various components. A gradient-based computational optimizer is then used to determine the design that minimizes the required power. Success of this design strategy depends on the accuracy of the aerodynamic model and structural predictions.
Several low and medium fidelity aerodynamic models have been implemented, including a simple momentum theory model, a blade-element model and a discrete vortex-ring model. The more advance vortex-ring model has the capability of computing the airflow pattern through the rotor in close proximity to the ground. Modelling this “ground-effect” is essential to the design of a helicopter that operates at such low altitude. The animation below shows the induced flow pattern as computed by the vortex-ring method. The graph shows how the induced power is reduced in proximity to the ground, where h/R is the fraction of the height to the rotor radius. The results of the vortex model are plotted along with empirically derived models given by several other authors.


The fraction of the induced power in ground effect to the induced power in free hover is plotted. "Vortex HF, MF and LF" represent high, medium and low grid resolution in the calculations.
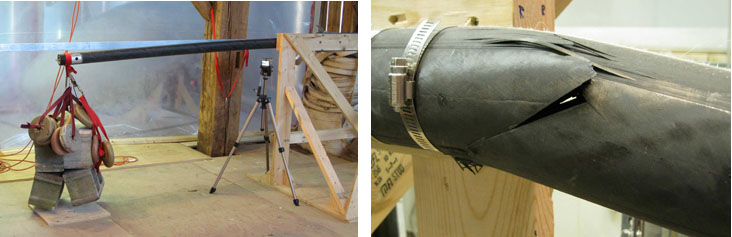
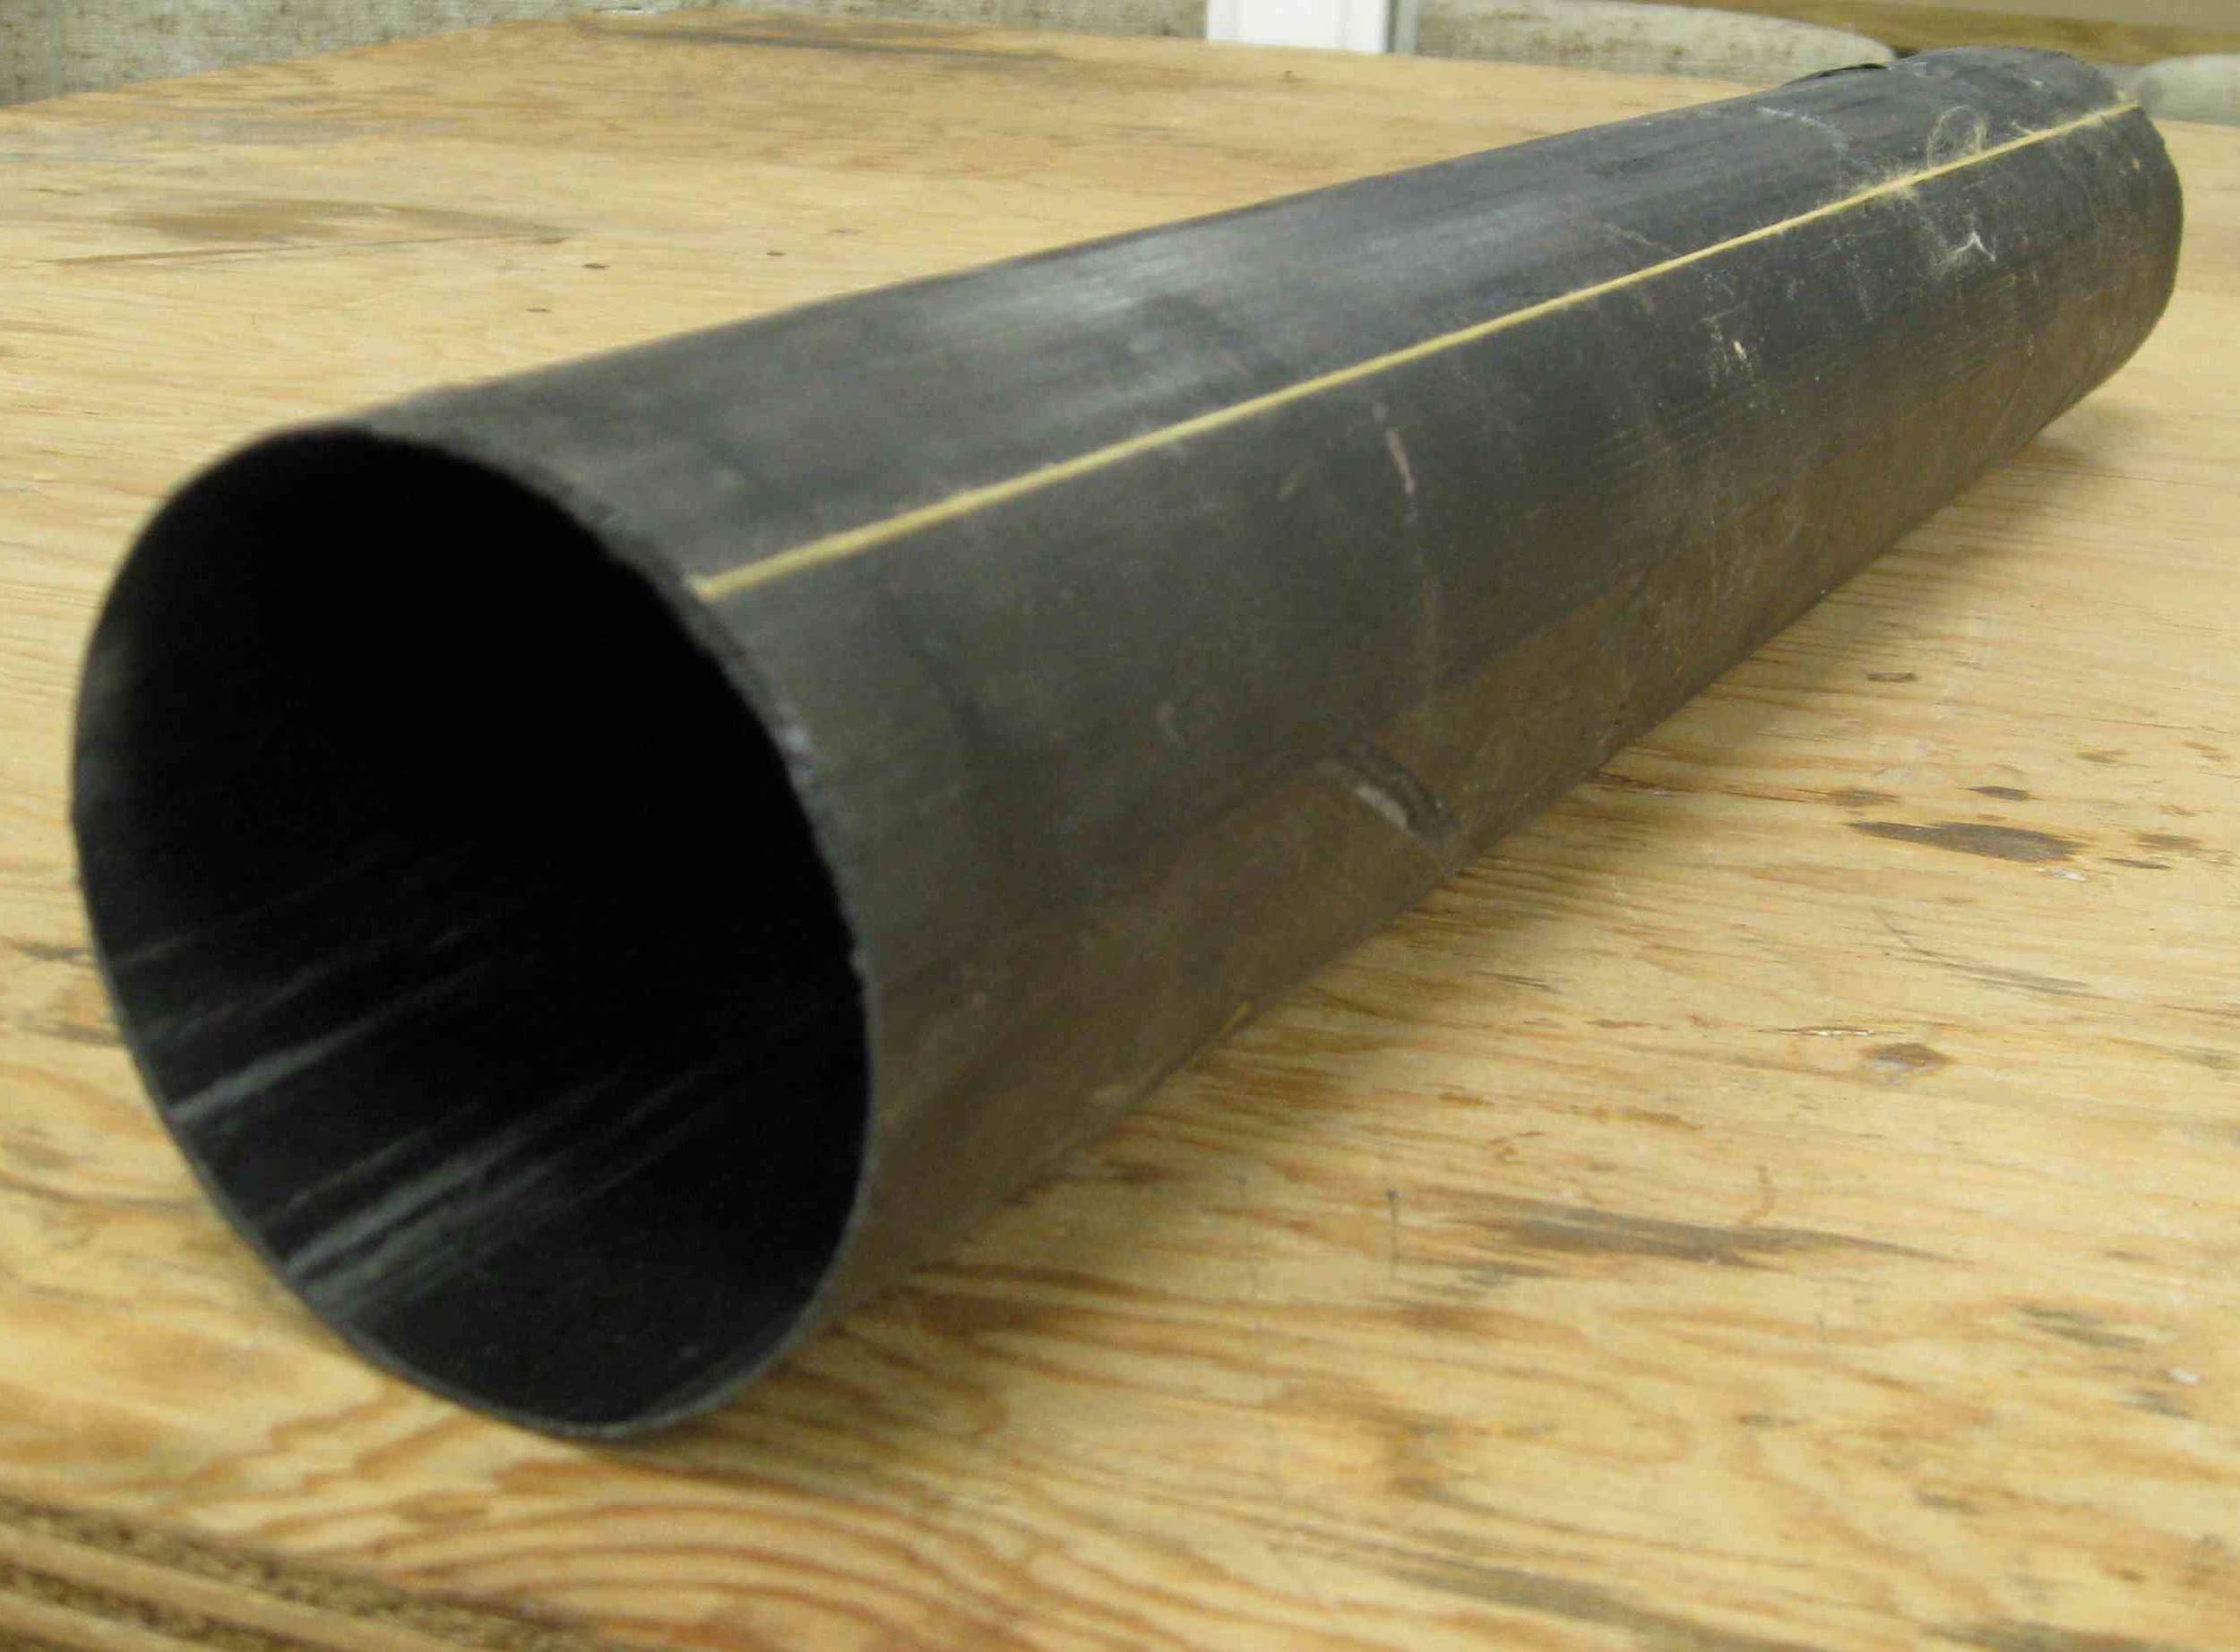
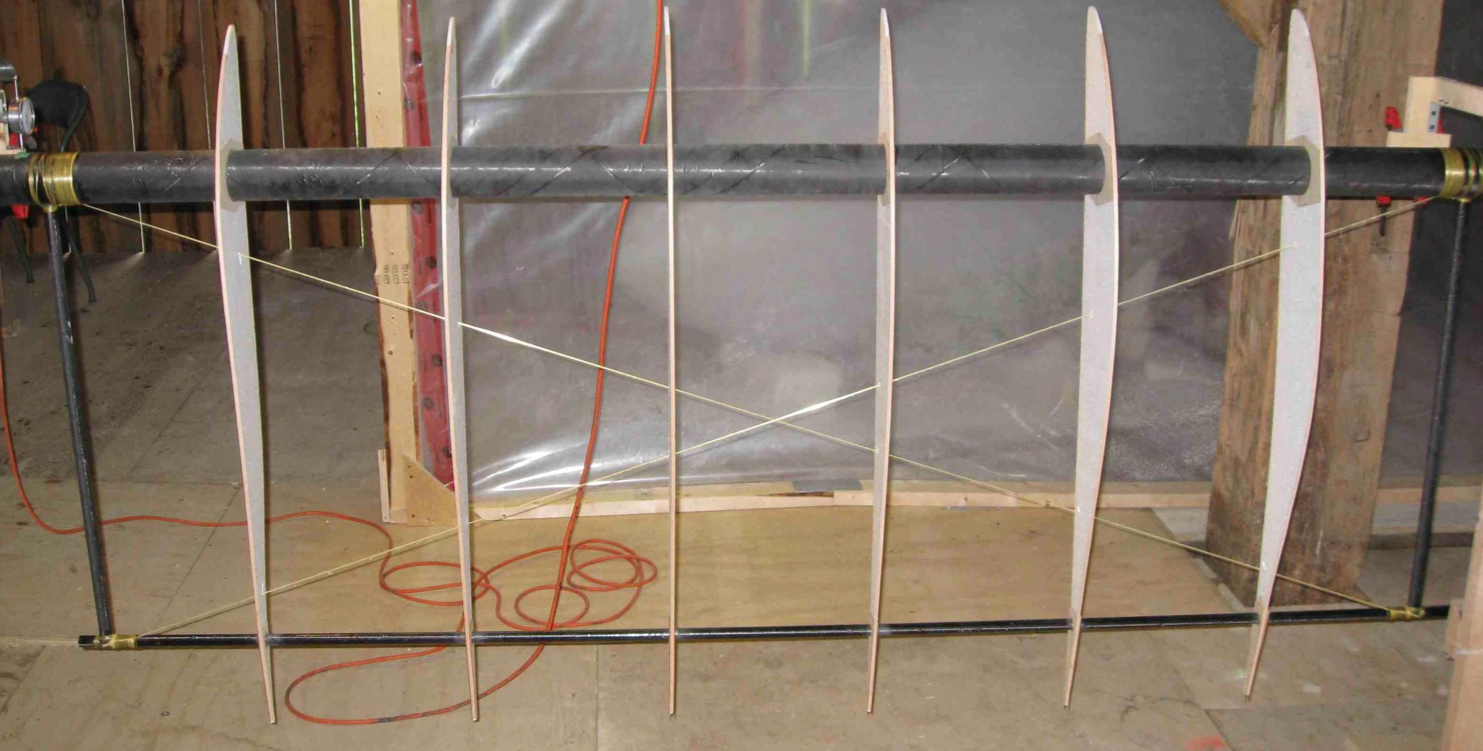
The structural model is a linear finite-element model based on classical engineering beam theory. Composite analysis methods are used to generate accurate structural properties and failure characteristics of the carbon fibre tubes. During the course of the human-powered ornithopter project extensive structural testing was performed on representative tubular specimens in order to fine-tune the model. This gave us the capability, at the outset of the project, of predicting structural deformation and failure to within 5% accuracy, resulting in a structure that is only just as heavy as it needs to be. The image below shows structural failure testing during the summer of 2009.
Finally, a gradient-based optimizer is used to navigate the design space and find a solution that truly results in minimum required power. The optimizer is able to evaluate the trade-off between the benefit of extra rotor diameter and the extra structural weight, or the benefit of wire bracing versus the extra aerodynamic drag, all while considering the aerodynamic efficiency and nearly a dozen different failure modes. The combined aero-structural model can evaluate a complete helicopter design in 0.1 to 15 seconds depending on the fidelity of the chosen model. This allows rapid design optimization that can be completed on the order of minutes instead of days.
Construction Techniques
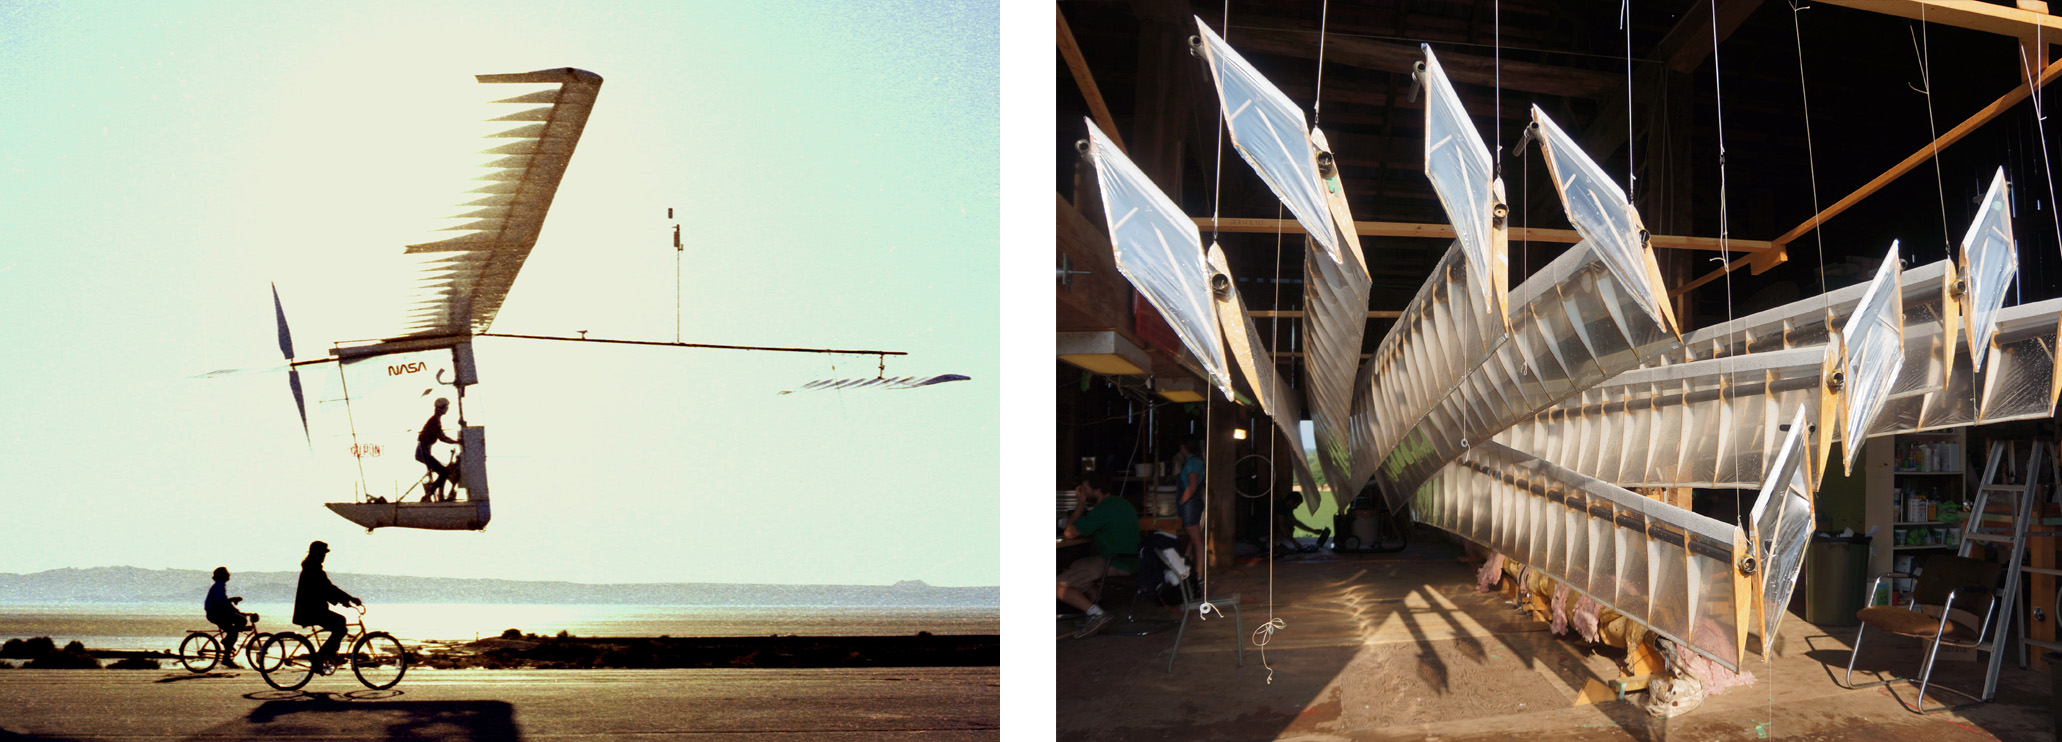
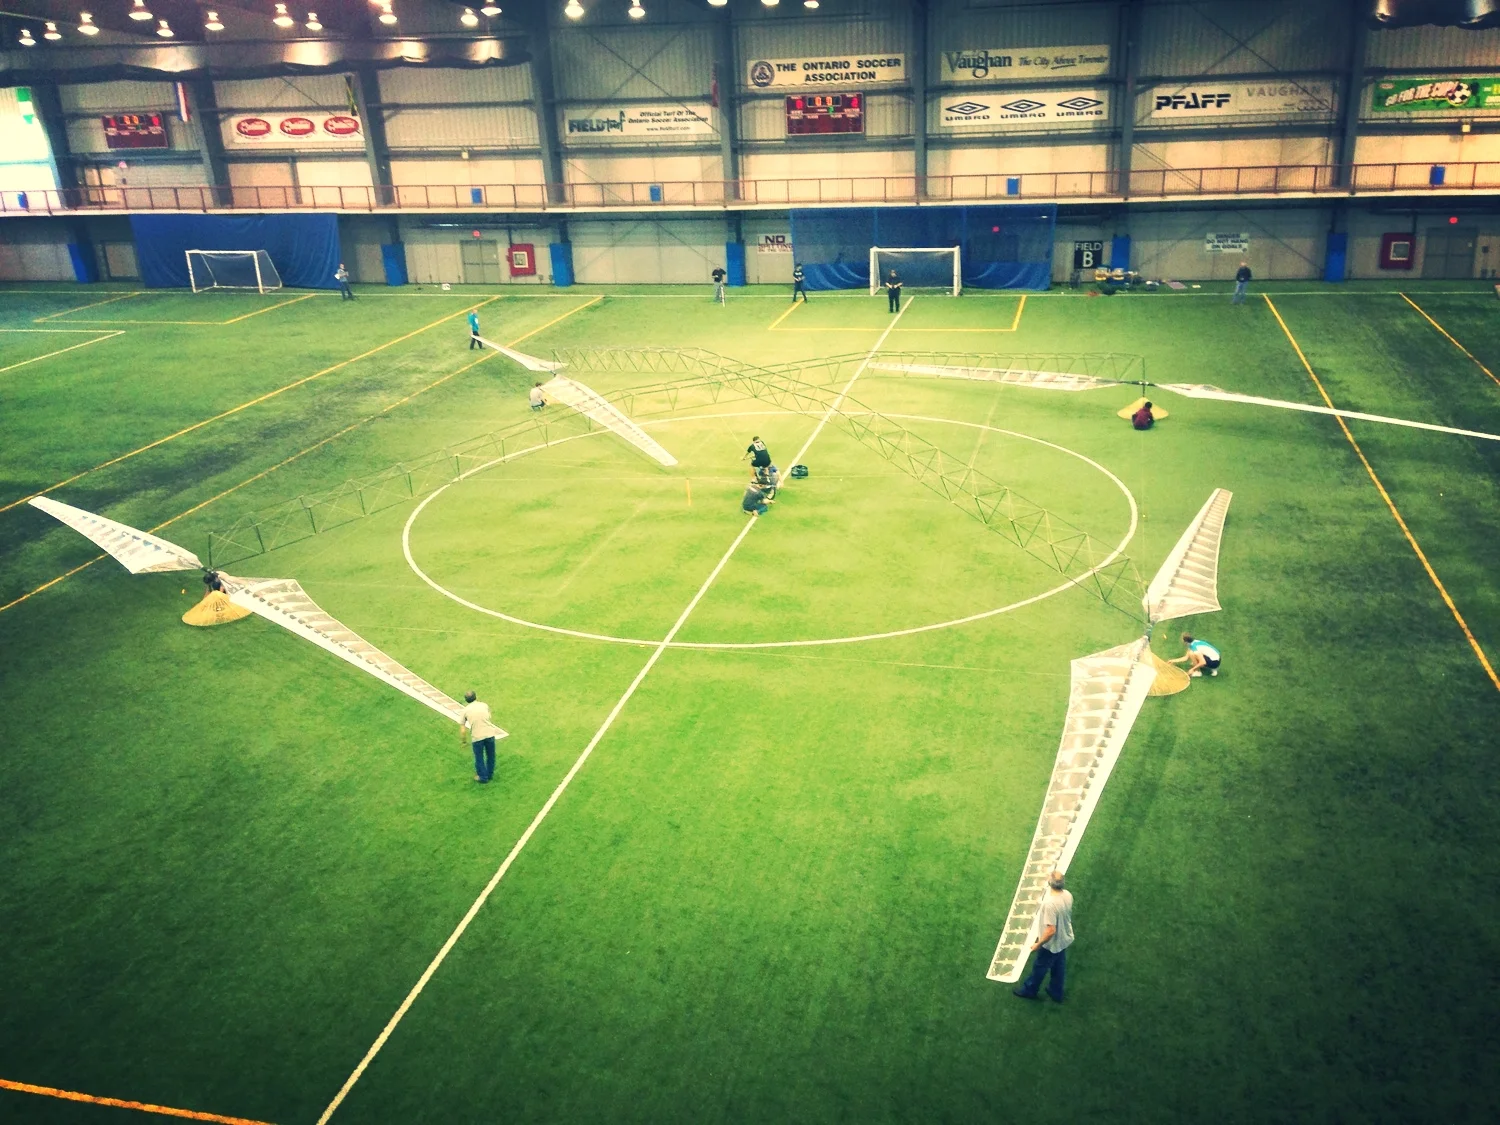
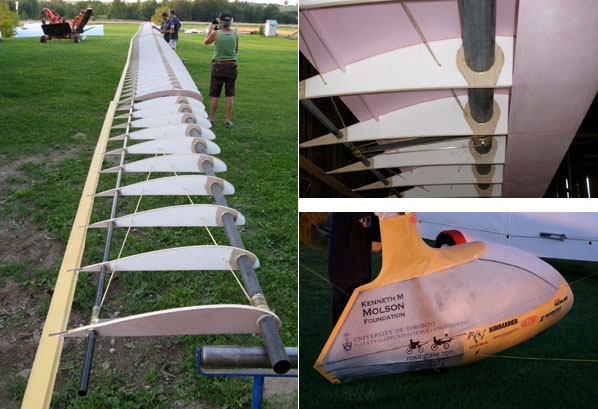
The rotors were constructed in a similar fashion to those of the Gossamer Albatross, a human-powered aircraft that crossed the English Channel in 1979. The main spar is a carbon fiber tube, whose structural weight is reduced through the use of wire bracing to share the lift loads. The airfoils are constructed with expanded polystyrene foam with balsa wood cap strips on the top and bottom. The rotor is then covered with an incredibly thin sheet of Mylar plastic film, making the whole rotor transparent. The images above show the structure of the Atlas rotors along side the Gossamer Albatross.
Power Plant

Maximum human power output (NASA 1964). The "First-class athletes" curve is slightly out of date, and these days many athletes include our pilot Todd Reichert can exceed the curve.
Todd Reichert was the pilot selected to fly the Atlas. Todd was a national-level speed skater and competitive athlete in the world of human-powered streamlined vehicles. His piloting background, as well as his experience flying the Snowbird human-powered ornithopter made him well suited for the job.
At the time Atlas was designed, the average power required for a 1 minute Sikorsky Prize flight estimated at 550 Watts for an 80 kg pilot like Todd. At 772 Watts for 1 minute, our pilot’s power output exceeded the power requirements of the helicopter by a safe margin. The predictions would have been more accurate if the helicopter could descend faster without entering a fatal vortex ring state, by in the Todd had to spend a lot more time at altitude and the average power for the flight ended up being just over 700 Watts.
Snowbird Technical Info
Snowbird
Technical Information
Snowbird Technical Info
Snowbird
Technical Information
General Layout and Operation
The image below gives a 3-view drawing of the aircraft, showing the primary carbon-fibre tube structure and the secondary foam, wood and covering structure. Additional drawings show the wing’s deflection through the stroke and the placement of the spar through the various sections of the wing, which is specifically designed to achieve the proper twisting kinematics through passive aero-elastic tailoring. On each stroke the pilot executes a leg press motion, which pulls down on wires connected to the main spar. The main spar has no hinge, and instead flexes to produce the desired flapping motion. Thrust is produced exclusively through the angle-of-attack mode, as it was decided that the mechanical complexity of a folding wing or changing camber would significantly reduce the chance of success. The Snowbird has a total span of 32 m, an empty weight of 44.7 kg and flies at a speed of 25.6 km/h.

Engineering drawing of the Snowbird Human-Powered Ornithopter
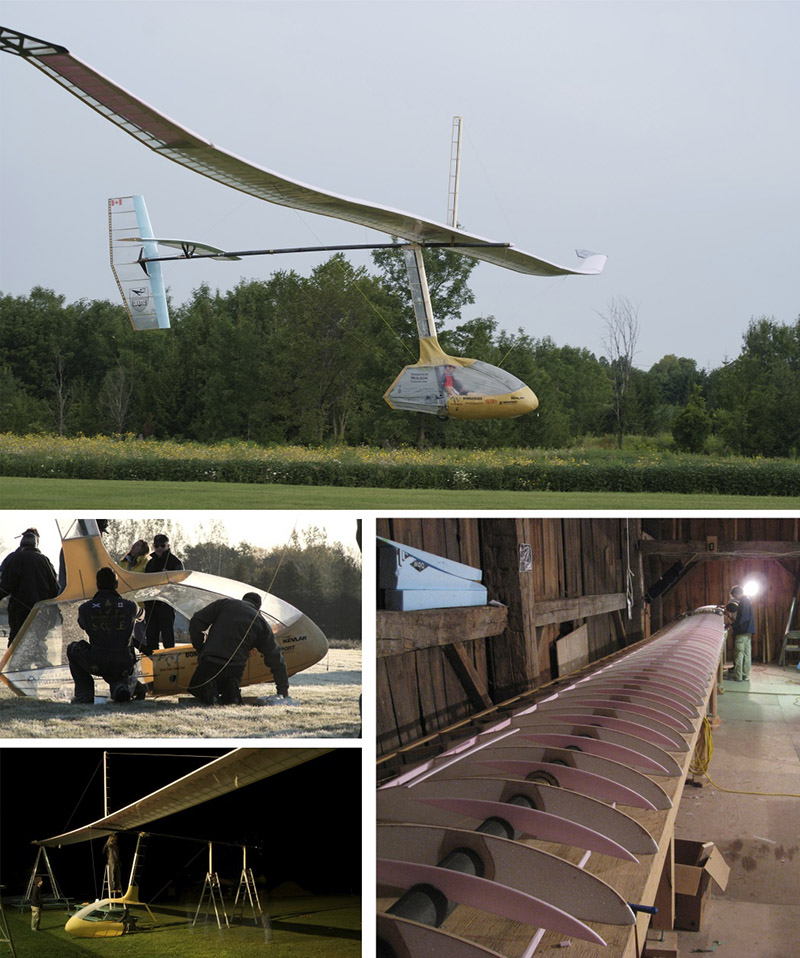
(Top) The Snowbird in flight, showing lag in wingtip deflection near the bottom of the downstroke. (Left) Fuselage on the runway during flight testing, and aircraft being assembled with ladders before dawn. (Right) Left main wing section under construction in the barn.
Primary Structure
The primary structure consists of the wing truss structure , the tail spars and the fuselage frame. It is composed of axially-wrapped carbon-fibre reinforced plastic tubes with unidirectional cap strips as shown in the figure below. The angle of the axial-wrap and number of cap strips is tailored specifically to the predicted loading of the tube. To build the tubes, pre-impregnated unidirectional carbon-fibre is first wrapped around an aluminum mandrel before setting the cap strips in place, wrapping the entire unit in heat-shrink tape and curing the tube in long ovens. Bulkheads are placed inside the tube at 6″ spacing to prevent torsional thin-walled buckling. On the wing the cap strips on the main spar provide the out-of-plane strength and stiffness, while in-plane forces are taken up by a truss structure of carbon-fibre tubes and Kevlar cross-bracing as shown below. Extensive structural testing of as-built sections was performed in order to develop an accurate semi-empirical model to predict the bending stiffness, EI, torsional stiffness, GJ, and failure properties.
Secondary Structure
The aerodynamic loads are carried from Mylar wing skin to the spar via thin foam and wood ribs as shown in Figure 12.9. The ribs have 1/16″ thick bass wood caps on the top and bottom and 1/32″ thick balsa plates on the sides to transfer load from the caps to the spar.
The pink extruded-polystyrene sheeting helps maintain the airfoil shape between ribs, which is crucial for the precisely designed laminar-flow airfoils. The sheeting is supported by small foam riblets between each rib and foam stringers as shown in Figure 12.7. The trailing edge is made from Rohacell structural foam laminated between two thin plies of woven Kevlar. The cockpit fairing has a thin Kevlar top and bottom shell and a support frame made from 1/4″ square balsa dowels with carbon-fibre cap strips. As with the wings, the frame is covered in thin Mylar sheeting.
Secondary structure. Left: Complete wing with ribs and trailing edge. Top Right: Addition of the foam leading-edge sheeting to the wing structure. Bottom Right: Fuselage fairing with yellow Kevlar shells on the top and bottom, carbon and balsa rib structure and Mylar covering.
Drive Mechanism
The drive system uses the lightweight bowsprit and footslider found on the Thys Rowingbike. The pilot clips into pedals attached to the footslider which is connected to the yellow dynema line in the HPO drivetrain photo below. The line connects, through a 2:1 block, to the drive wires (the white lines in the photo), which are attached directly to the wing spar, 10 m out on the wing. Static lines connect from bottom of fuselage and top of kingpost to a point 6 m out on the wing as shown in the 3-view above. The lines from kingpost prevent the wing from failing under its own gravitational load when not in flight, and at bottom of the downstroke when wing is being deflected downward. The static lines from fuselage help take some of the load of the drive wires, so pilot is not carrying the average lift loads in addition to providing the force for the unsteady lift loads. The presence of these static wires makes it such that it is primarily the outboard section of the wing that is flapping and providing the thrust as shown in the engineering drawing flapping sequence above, and the video stills sequence below.

(Left to Right) Linear drive system on the Thys Rowingbike. Drive system as seen from the bottom of the aircraft with 2:1 pulley and lines going out to each wing.
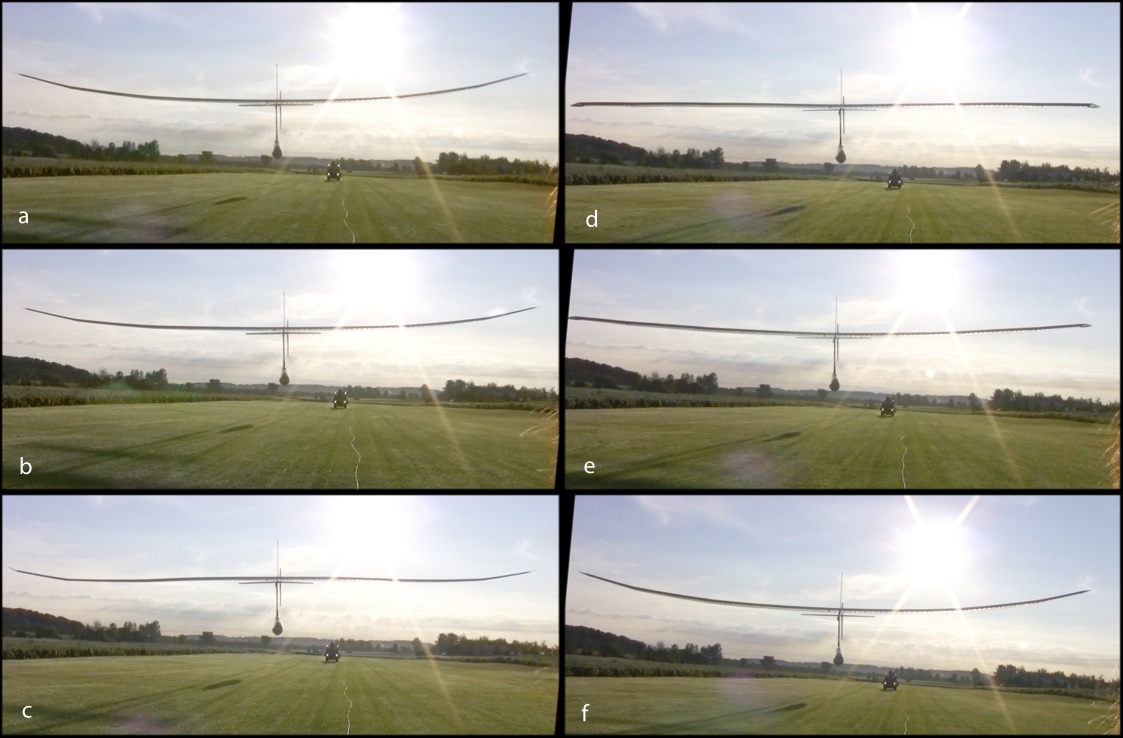
Wing motion during flight at various fractions of one stroke (0, 0.17, 0.41, 0.59, 0.71, 1).
Airfoil Design
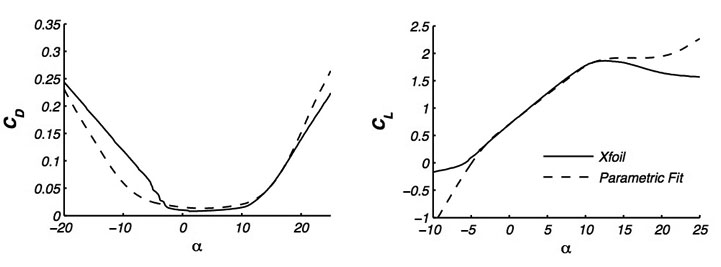
The final airfoils shown in the engineering drawing above. The airfoils were modified from the well-tested Daedalus sections, using a genetic optimization algorithm to fine tune the airfoils over their specified angle-of-attack range. This resulted in airfoils with a higher maximum CL and a softer stall, but at the cost of slightly higher drag in the middle of the operating range. The airfoil polars are shown below along side the DAE root airfoil, which operates at the same Re as the DT-HPO2 airfoil. The next figure shows the pressure profile of the root airfoil at the design lift coefficient, where the bump in the blue line indicates the laminar separation bubble and transition point, which is the main focus of low Re airfoil design.

Drag polars, lift and moment coefficient, and boundary layer transition as output from XFOIL. The designations 1 through 4 refer to the root, elbow, wrist and tip airfoils.
As mentioned previously, glide and tow testing had shown that the total drag of the aircraft was much higher than predicted. One possible cause was early transition because of poor leading edge treatment. The root airfoil pressure profile shows the resulting polar if the boundary layer on the upper surface is tripped at the leading edge. This premature transition is shown to substantially lower the maximum CL and increases drag far beyond what would be expected from simply the increase in skin friction drag due to a turbulent boundary layer.
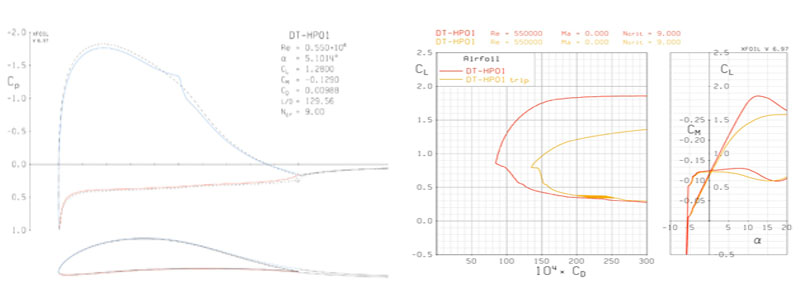
Pressure coefficient at the design CL, output from XFOIL (left). Resulting drag polar if the boundary layer is prematurely tripped on the upper surface of the airfoil (right).
As far as modeling the performance of the airfoil, in order for the aero-structural code to converge, the lift curve must be parameterized such that it is monotonically increasing. The parametric airfoil fits were thus modified as shown below. On some airfoils it is necessary to add a stalled leading-edge suction efficiency to the parametric model to obtain a good fit. This was certainly the case with the Snowbird airfoils, designed specifically for good stall-transition behaviour, which achieved a stalled leading-edge suction efficiency of 75%. In the post analysis of the aircraft, the drag curve was shifted up by 1.5 times in order to account for possible drag increases due to early boundary-layer transition.
Parametric airfoil fit to be used in the vortex-panel aerodynamic model. For aero-structural convergence considerations, the lift fit has been modified to be monotonically increasing.
Wing Design
The wing was designed to minimize the total required power, which involves producing efficient lift through the choice of general planform and airfoil, and producing efficient thrust by optimizing the kinematics as discussed throughout this thesis. All design simulations were performed with the full non-linear aero-structural model, using 8 panels per wing and 20 time steps per flapping cycle. Producing the proper kinematics involves a careful choice of elastic-axis location, sweep, and bending and torsional stiffness. The mass was minimized as much as possible, especially aft of the elastic axis since this is known to have a detrimental effect on the aero-elastic twist phasing. The following two figures show the final wing design parameters.
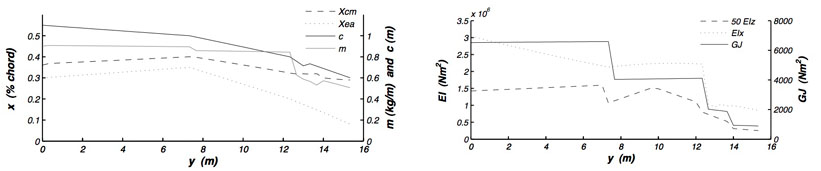
Structural design parameters along the span of the wing.
The general philosophy is that placing Xea in front of the aerodynamic centre, or employing sweep on an outboard section, can be used to drive the twisting deformation of a given section. The purpose of the “bat tip”, which attaches on the end of the wing, is to help extend the twist magnitude right to the wing tip. At the root, Xea is much further back, first because the inboard section is not being used to produce thrust, and second because it helps reduce the torsional loads at the root that build up from the sweep and forward elastic-axis position on the outer panels. Finally, with the given Xea and sweep, the wing will deflect to a washed-out state under steady lift loads, so it is necessary to jig the wing with a washed-in pre-twist, as shown in the figure below
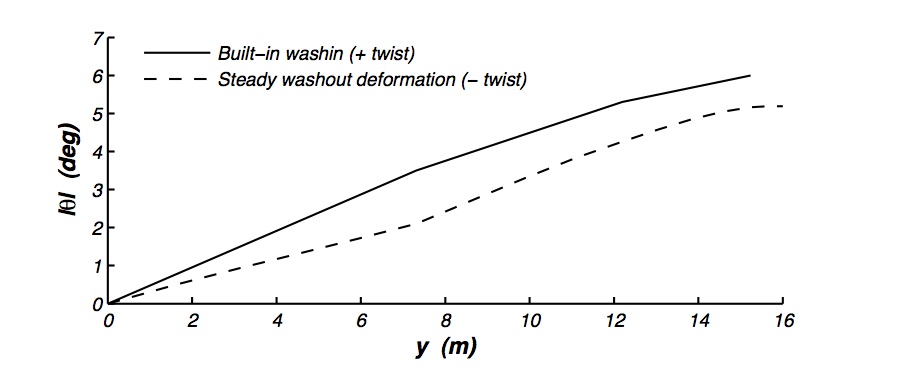
Magnitude of the built-in washin on the Snowbird, designed to roughly cancel out the steady twist deformation under normal flight loads.
These plots show the magnitude and phase relationships of the important aerodynamic and kinematic parameters in the design of the aircraft. The focus is on the panels outboard of the static lines (y > 6m), which are responsible for producing the thrust. The slight phase difference in the plunging magnitude h, going from the static lines out to the tip, represents the phase delay in the flapping motion caused by the extreme flexibility of the spar. Fortunately, it was possible to tailor the twisting for a similar phase-delay pattern, and the resulting phase relationship between the plunging and the unsteady CL is quite close to the ideal 90-100 degrees over the entire outboard section. This is a considerable achievement given the flexibility of the spar and the complexity of the plunging motion.
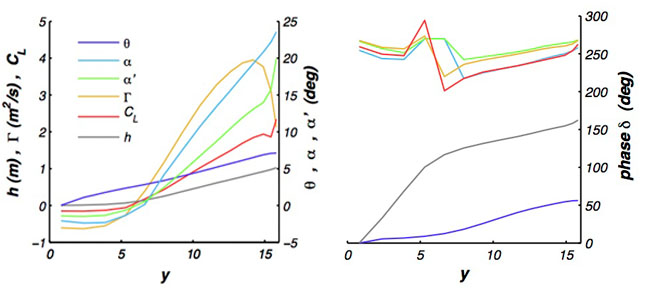
Magnitude and phase of the key aerodynamic parameters, plotted along the span of the wing, y. The parameters are: plunging deformation, h, twisting deformation, theta, kinematic angle of attack, alpha, total relative angle of attack, alpha prime, bound circulation, Gamma, and lift coefficient, CL.
Power Requirements
This figure shows the power requirements of the Snowbird plotted along side several human-powered, propeller-driven aircraft. The power was computed using the Ornithia toolbox, with parameters adjusted to match the actual weight and gliding drag of the final flight vehicle. The required power is significantly higher than originally predicted, due to the substantial drag increase previously mentioned.
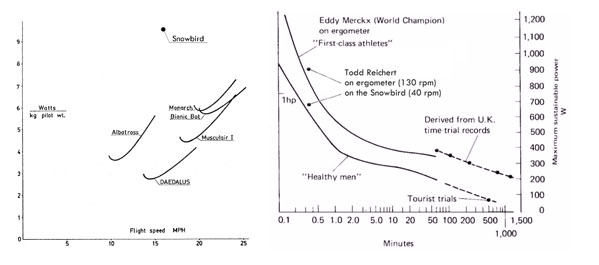
Required power of various human-powered aircraft, and available power from the human engine. The pilot was specifically trained for short sprints, which explains why his 20-second ergometer score is above that of the World Champion cyclist, trained for endurance events.
The figure also shows the power typically available from a male athlete for a given amount of time. The Snowbird’s required power is marked, along with the pilot’s maximum 20-second power measured on a cycling ergometer. The results show the poor efficiency of the low frequency rowing motion at such high power outputs. Studies early on in the project showed that the ideal pilot frequency for an output of 320 W was near 0.65 Hz, which subsequently formed the basis of the design, and resulted in a wing that was structurally tuned to perform at that specific frequency. Higher power outputs have correspondingly higher optimal frequencies, so unfortunately, the higher-than-predicted power of the Snowbird made the 0.65 Hz a non-optimal frequency for the pilot.
Stability and Control
Based on previous experience with the stability of ornithopters, the stability of the Snowbird was analyzed assuming it would perform in a similar fashion to an identical fixed wing aircraft with the same average dihedral. The aircraft was analyzed as if all deformations of the structure were quasi-steady. That is, it was assumed to be a rigid aircraft, but with the stability derivatives modified to take into account the steady-state bending and twisting deformation of the wing.
More extensive methods of analysis were presented by Drela, but were not employed due to time considerations. Because of the similarity in the designs of the Snowbird and the Daedalus, the team was confident that with a similar average dihedral and control surface sizes, the aircraft would be controllable.
Both the horizontal and vertical stabilizers are all moving surfaces hinged about the aerodynamic centre and actuated by standard hobby servos. The aircraft has no ailerons and turns are made with the rudder and appropriately designed yaw-roll coupling. The control response was found to be typical of human-powered aircraft, being extremely slow to turn because of the excessively large moments of inertia. The centre of mass was set such that the tail had zero lift force, giving a small static margin, but one that was easily controllable given the generally slow movements of the aircraft.
Mass Breakdown
The mass of the every component of the aircraft was meticulously measured during construction. A breakdown of the mass distribution is given below. Roughly 60% of the wing’s weight is the primary structure, with the secondary structure of ribs, leading-edge sheeting and covering making up the remaining 40%. The tail surfaces contribute a relatively small 5.6%, compared with the fuselage, 32.8%, and the wing, 61.6%. In total, the weight of the aircraft is only 63% of the pilot weight.
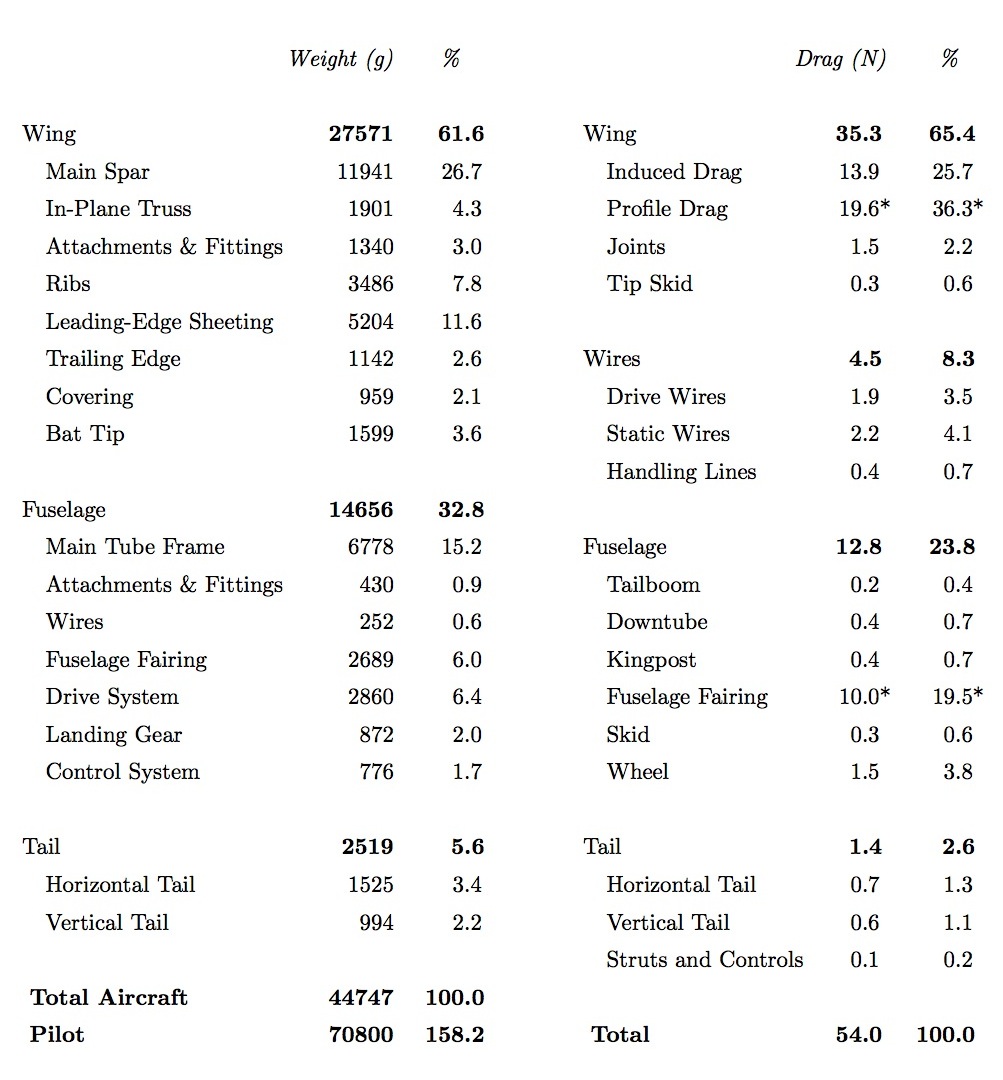
Mass and drag breakdown of the Snowbird. The proportions of the two largest drag contributors, marked with a “*” are rough estimates based on available data.
Drag Breakdown
The drag of most of the aerodynamic surfaces, wires and frame elements could be easily estimated from analytic formulas and 2D airfoil simulations in XFOIL. The total drag was measured through both glide testing and tow testing with a fish scale, however, the relative proportions of the two largest suspected drag contributors, wing profile drag and the drag of the fuselage fairing, remains unknown. It is likely that premature boundary layer transition substantially increased the profile drag of the wing. It is also possible that the damaged fuselage fairing in addition to a small sideslip angle, caused by a slight asymmetry in the twist of the wings, caused flow separation over parts of the shell. The best estimate of the drag breakdown of the aircraft is given in the table above.
Record Flight
To achieve flight, the Snowbird is first towed into the air by car. Upon release, the goal was to maintain both altitude and airspeed for as long as possible. Throughout October of 2009, and July and August of 2010, a total of 16 ground-handling tests and 52 flight test were performed, during which the airframe, the controls and the pilot’s skills were all improved. Of the 52 test flights, 38 included an attempt at flapping and 8 recorded brief moments of sustained flight. The following figure shows the flight data from the aircraft’s best performance, recorded on August 2nd, 2010 at 6:35am, where both altitude and airspeed were maintained for 19.3 seconds. Speed data was acquired with an onboard GPS flight data recorder; elevation data was acquired from a ground survey, and altitude data was acquired with a video camera set up specifically for that purpose.
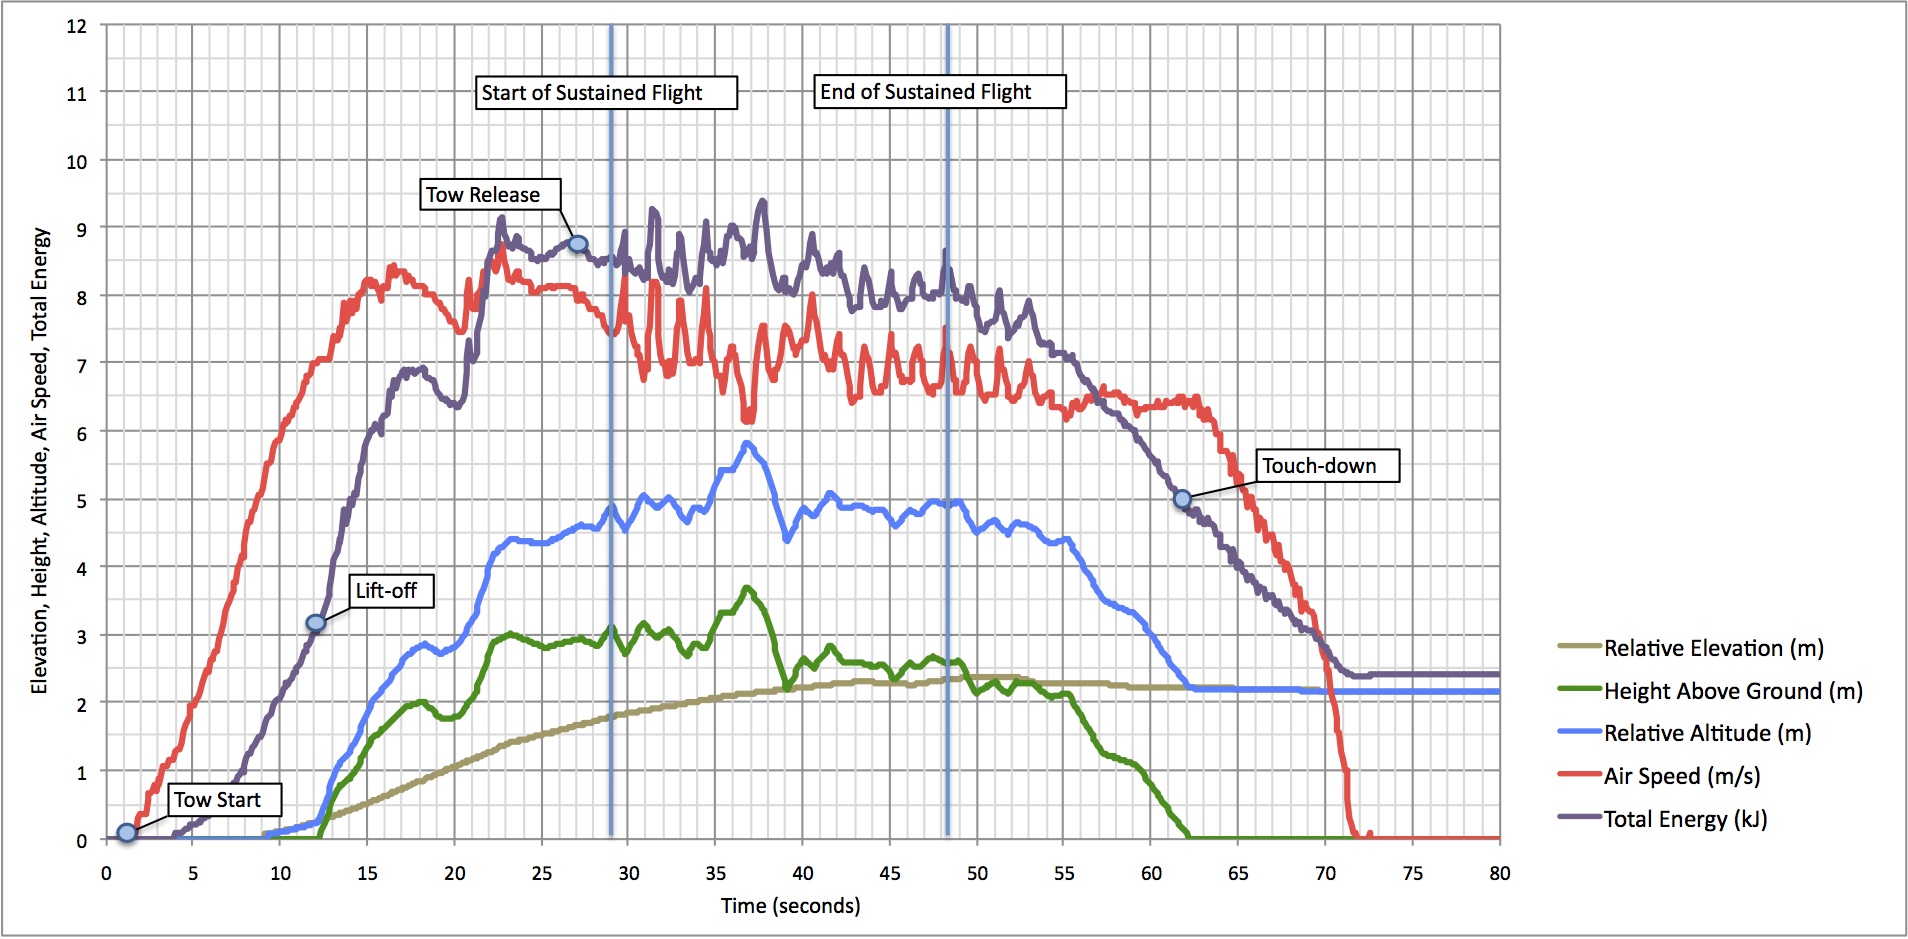
Analysis of record flight on August 2nd, 2010, with speed data recorded from the onboard GPS, surveyed elevation data, and altitude data pulled from side-view flight video.