
General Layout and Operation
The image below gives a 3-view drawing of the aircraft, showing the primary carbon-fibre tube structure and the secondary foam, wood and covering structure. Additional drawings show the wing’s deflection through the stroke and the placement of the spar through the various sections of the wing, which is specifically designed to achieve the proper twisting kinematics through passive aero-elastic tailoring. On each stroke the pilot executes a leg press motion, which pulls down on wires connected to the main spar. The main spar has no hinge, and instead flexes to produce the desired flapping motion. Thrust is produced exclusively through the angle-of-attack mode, as it was decided that the mechanical complexity of a folding wing or changing camber would significantly reduce the chance of success. The Snowbird has a total span of 32 m, an empty weight of 44.7 kg and flies at a speed of 25.6 km/h.

Engineering drawing of the Snowbird Human-Powered Ornithopter
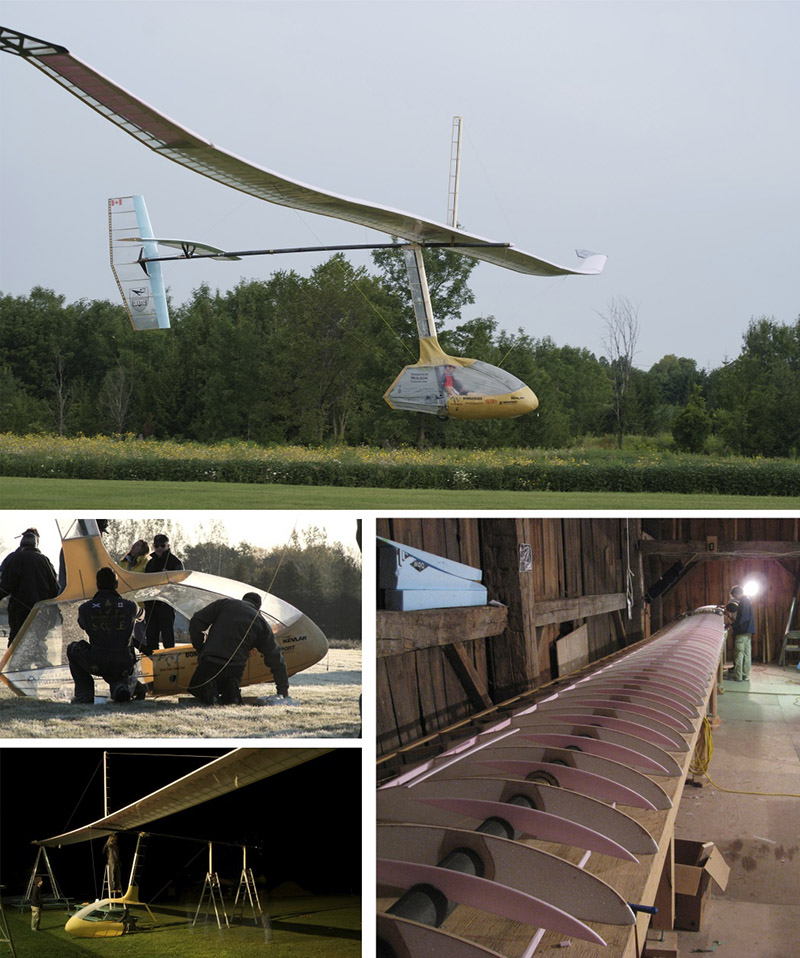
(Top) The Snowbird in flight, showing lag in wingtip deflection near the bottom of the downstroke. (Left) Fuselage on the runway during flight testing, and aircraft being assembled with ladders before dawn. (Right) Left main wing section under construction in the barn.
Primary Structure
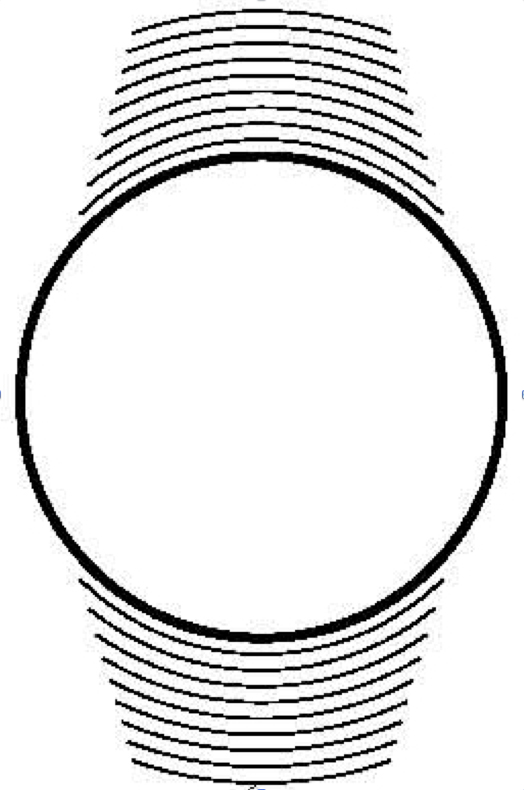
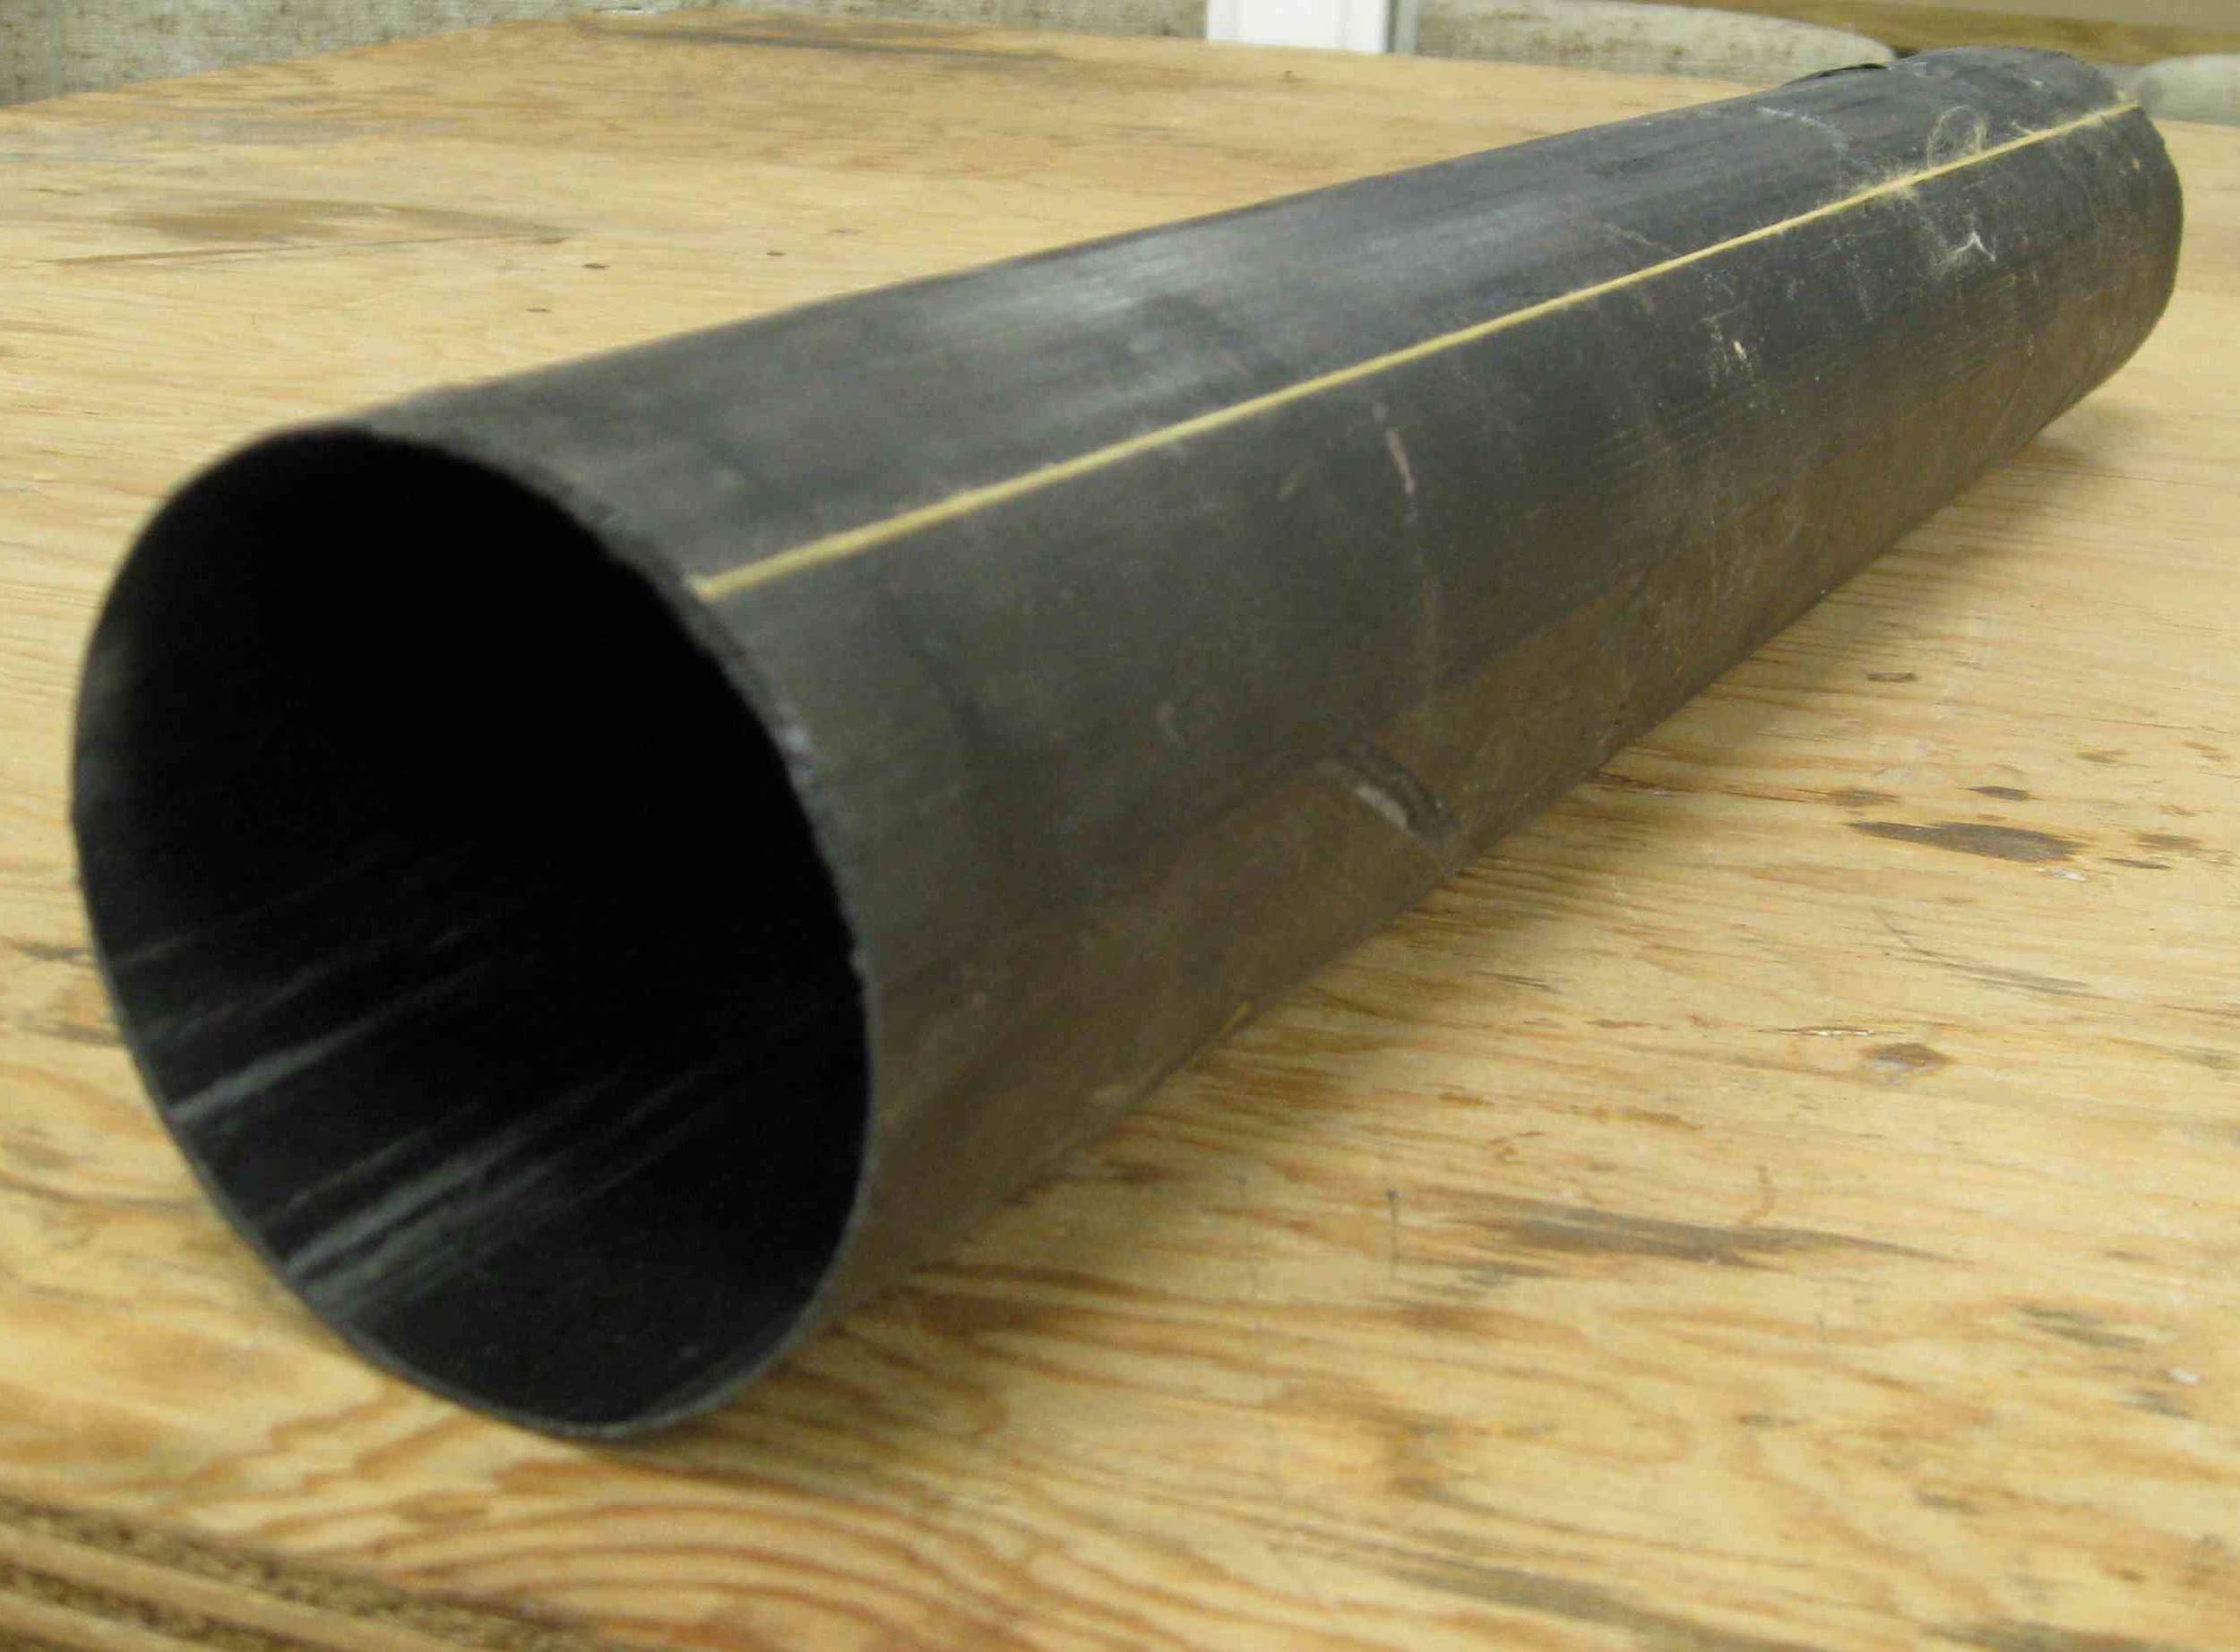
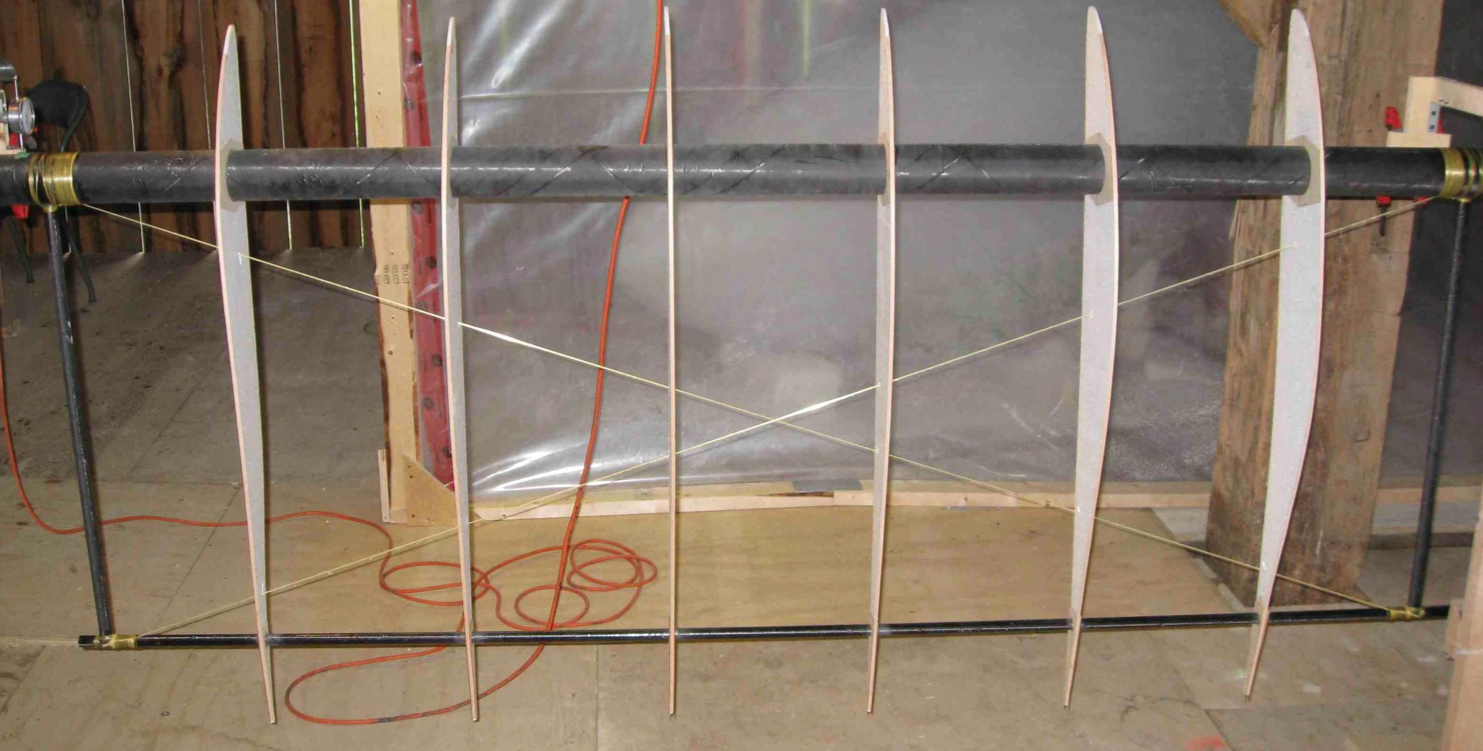
The primary structure consists of the wing truss structure , the tail spars and the fuselage frame. It is composed of axially-wrapped carbon-fibre reinforced plastic tubes with unidirectional cap strips as shown in the figure below. The angle of the axial-wrap and number of cap strips is tailored specifically to the predicted loading of the tube. To build the tubes, pre-impregnated unidirectional carbon-fibre is first wrapped around an aluminum mandrel before setting the cap strips in place, wrapping the entire unit in heat-shrink tape and curing the tube in long ovens. Bulkheads are placed inside the tube at 6″ spacing to prevent torsional thin-walled buckling. On the wing the cap strips on the main spar provide the out-of-plane strength and stiffness, while in-plane forces are taken up by a truss structure of carbon-fibre tubes and Kevlar cross-bracing as shown below. Extensive structural testing of as-built sections was performed in order to develop an accurate semi-empirical model to predict the bending stiffness, EI, torsional stiffness, GJ, and failure properties.
Secondary Structure
The aerodynamic loads are carried from Mylar wing skin to the spar via thin foam and wood ribs as shown in Figure 12.9. The ribs have 1/16″ thick bass wood caps on the top and bottom and 1/32″ thick balsa plates on the sides to transfer load from the caps to the spar.
The pink extruded-polystyrene sheeting helps maintain the airfoil shape between ribs, which is crucial for the precisely designed laminar-flow airfoils. The sheeting is supported by small foam riblets between each rib and foam stringers as shown in Figure 12.7. The trailing edge is made from Rohacell structural foam laminated between two thin plies of woven Kevlar. The cockpit fairing has a thin Kevlar top and bottom shell and a support frame made from 1/4″ square balsa dowels with carbon-fibre cap strips. As with the wings, the frame is covered in thin Mylar sheeting.
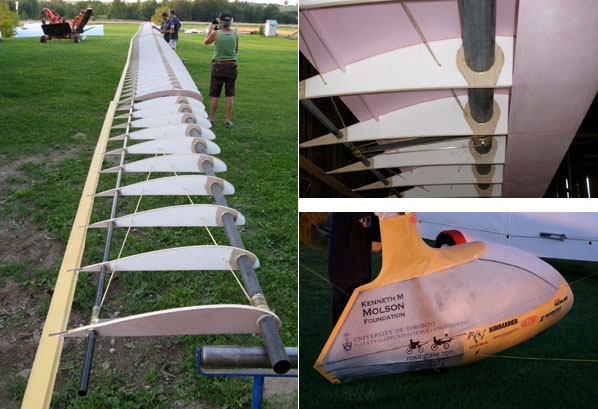
Secondary structure. Left: Complete wing with ribs and trailing edge. Top Right: Addition of the foam leading-edge sheeting to the wing structure. Bottom Right: Fuselage fairing with yellow Kevlar shells on the top and bottom, carbon and balsa rib structure and Mylar covering.
Drive Mechanism
The drive system uses the lightweight bowsprit and footslider found on the Thys Rowingbike. The pilot clips into pedals attached to the footslider which is connected to the yellow dynema line in the HPO drivetrain photo below. The line connects, through a 2:1 block, to the drive wires (the white lines in the photo), which are attached directly to the wing spar, 10 m out on the wing. Static lines connect from bottom of fuselage and top of kingpost to a point 6 m out on the wing as shown in the 3-view above. The lines from kingpost prevent the wing from failing under its own gravitational load when not in flight, and at bottom of the downstroke when wing is being deflected downward. The static lines from fuselage help take some of the load of the drive wires, so pilot is not carrying the average lift loads in addition to providing the force for the unsteady lift loads. The presence of these static wires makes it such that it is primarily the outboard section of the wing that is flapping and providing the thrust as shown in the engineering drawing flapping sequence above, and the video stills sequence below.

(Left to Right) Linear drive system on the Thys Rowingbike. Drive system as seen from the bottom of the aircraft with 2:1 pulley and lines going out to each wing.
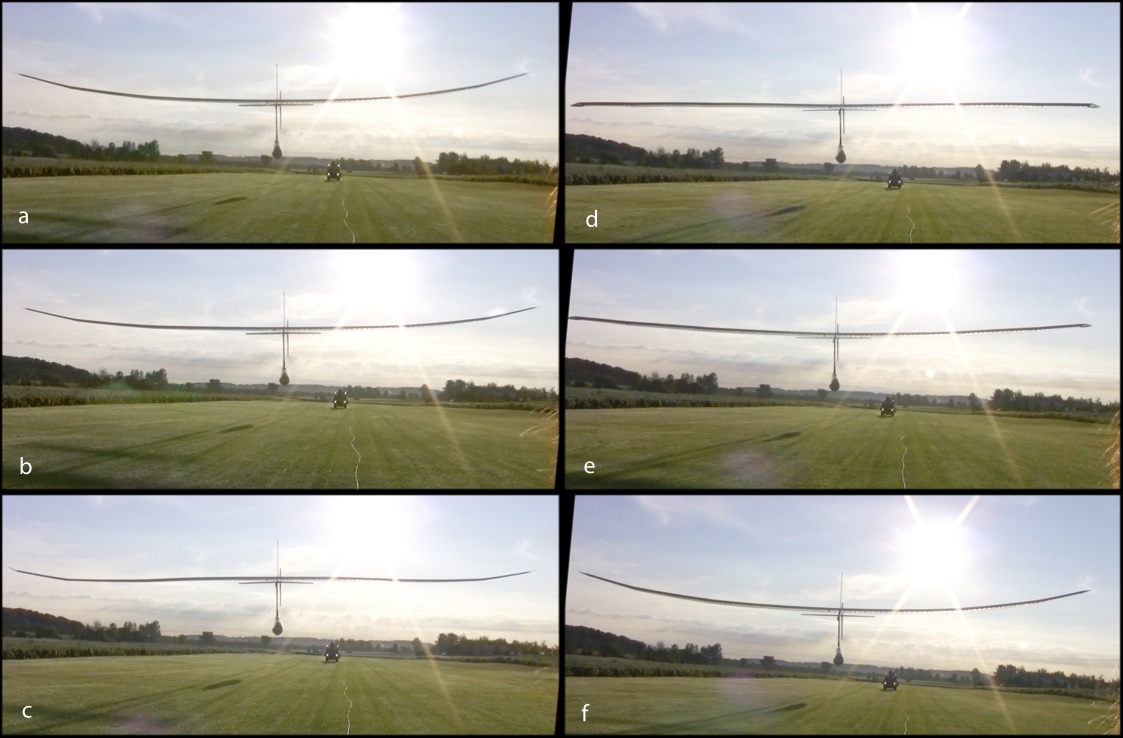
Wing motion during flight at various fractions of one stroke (0, 0.17, 0.41, 0.59, 0.71, 1).
Airfoil Design
The final airfoils shown in the engineering drawing above. The airfoils were modified from the well-tested Daedalus sections, using a genetic optimization algorithm to fine tune the airfoils over their specified angle-of-attack range. This resulted in airfoils with a higher maximum CL and a softer stall, but at the cost of slightly higher drag in the middle of the operating range. The airfoil polars are shown below along side the DAE root airfoil, which operates at the same Re as the DT-HPO2 airfoil. The next figure shows the pressure profile of the root airfoil at the design lift coefficient, where the bump in the blue line indicates the laminar separation bubble and transition point, which is the main focus of low Re airfoil design.

Drag polars, lift and moment coefficient, and boundary layer transition as output from XFOIL. The designations 1 through 4 refer to the root, elbow, wrist and tip airfoils.
As mentioned previously, glide and tow testing had shown that the total drag of the aircraft was much higher than predicted. One possible cause was early transition because of poor leading edge treatment. The root airfoil pressure profile shows the resulting polar if the boundary layer on the upper surface is tripped at the leading edge. This premature transition is shown to substantially lower the maximum CL and increases drag far beyond what would be expected from simply the increase in skin friction drag due to a turbulent boundary layer.
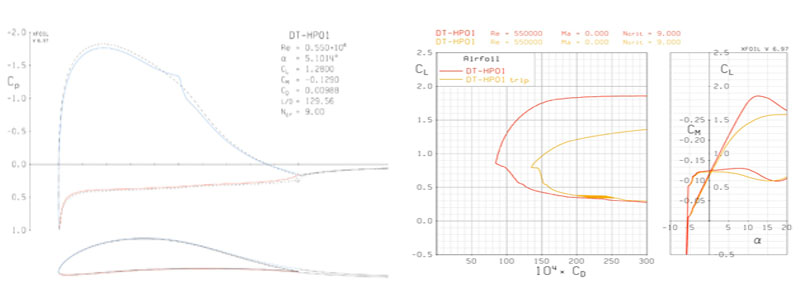
Pressure coefficient at the design CL, output from XFOIL (left). Resulting drag polar if the boundary layer is prematurely tripped on the upper surface of the airfoil (right).
As far as modeling the performance of the airfoil, in order for the aero-structural code to converge, the lift curve must be parameterized such that it is monotonically increasing. The parametric airfoil fits were thus modified as shown below. On some airfoils it is necessary to add a stalled leading-edge suction efficiency to the parametric model to obtain a good fit. This was certainly the case with the Snowbird airfoils, designed specifically for good stall-transition behaviour, which achieved a stalled leading-edge suction efficiency of 75%. In the post analysis of the aircraft, the drag curve was shifted up by 1.5 times in order to account for possible drag increases due to early boundary-layer transition.
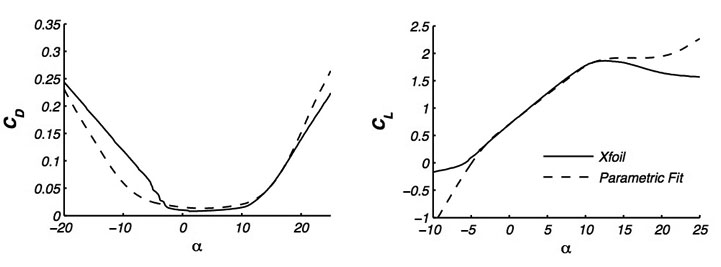
Parametric airfoil fit to be used in the vortex-panel aerodynamic model. For aero-structural convergence considerations, the lift fit has been modified to be monotonically increasing.
Wing Design
The wing was designed to minimize the total required power, which involves producing efficient lift through the choice of general planform and airfoil, and producing efficient thrust by optimizing the kinematics as discussed throughout this thesis. All design simulations were performed with the full non-linear aero-structural model, using 8 panels per wing and 20 time steps per flapping cycle. Producing the proper kinematics involves a careful choice of elastic-axis location, sweep, and bending and torsional stiffness. The mass was minimized as much as possible, especially aft of the elastic axis since this is known to have a detrimental effect on the aero-elastic twist phasing. The following two figures show the final wing design parameters.
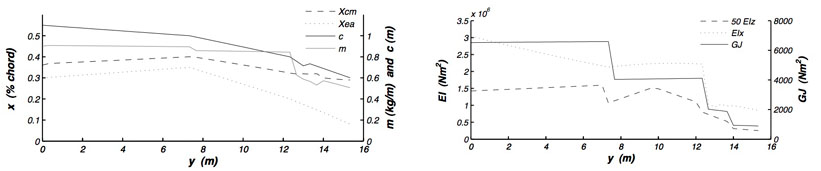
Structural design parameters along the span of the wing.
The general philosophy is that placing Xea in front of the aerodynamic centre, or employing sweep on an outboard section, can be used to drive the twisting deformation of a given section. The purpose of the “bat tip”, which attaches on the end of the wing, is to help extend the twist magnitude right to the wing tip. At the root, Xea is much further back, first because the inboard section is not being used to produce thrust, and second because it helps reduce the torsional loads at the root that build up from the sweep and forward elastic-axis position on the outer panels. Finally, with the given Xea and sweep, the wing will deflect to a washed-out state under steady lift loads, so it is necessary to jig the wing with a washed-in pre-twist, as shown in the figure below
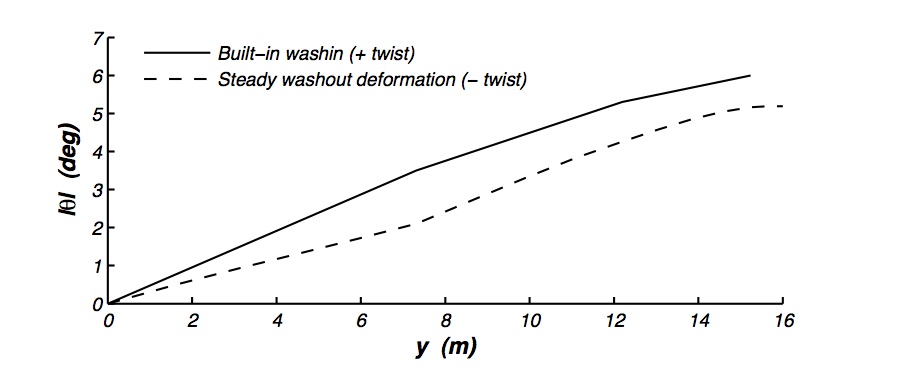
Magnitude of the built-in washin on the Snowbird, designed to roughly cancel out the steady twist deformation under normal flight loads.
These plots show the magnitude and phase relationships of the important aerodynamic and kinematic parameters in the design of the aircraft. The focus is on the panels outboard of the static lines (y > 6m), which are responsible for producing the thrust. The slight phase difference in the plunging magnitude h, going from the static lines out to the tip, represents the phase delay in the flapping motion caused by the extreme flexibility of the spar. Fortunately, it was possible to tailor the twisting for a similar phase-delay pattern, and the resulting phase relationship between the plunging and the unsteady CL is quite close to the ideal 90-100 degrees over the entire outboard section. This is a considerable achievement given the flexibility of the spar and the complexity of the plunging motion.
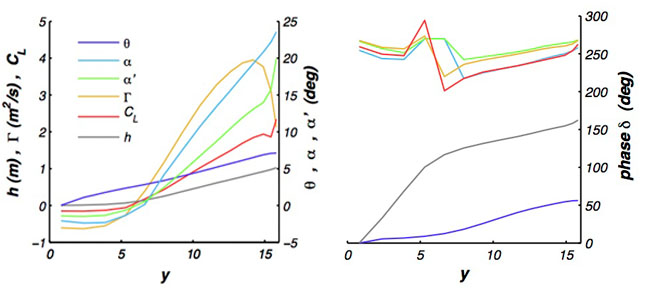
Magnitude and phase of the key aerodynamic parameters, plotted along the span of the wing, y. The parameters are: plunging deformation, h, twisting deformation, theta, kinematic angle of attack, alpha, total relative angle of attack, alpha prime, bound circulation, Gamma, and lift coefficient, CL.
Power Requirements
This figure shows the power requirements of the Snowbird plotted along side several human-powered, propeller-driven aircraft. The power was computed using the Ornithia toolbox, with parameters adjusted to match the actual weight and gliding drag of the final flight vehicle. The required power is significantly higher than originally predicted, due to the substantial drag increase previously mentioned.
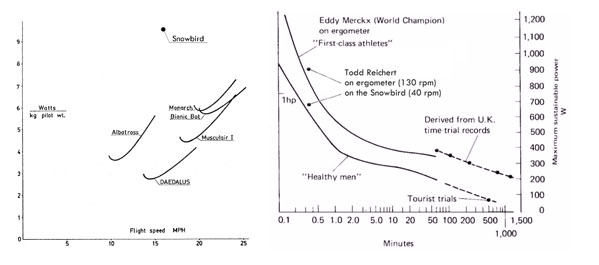
Required power of various human-powered aircraft, and available power from the human engine. The pilot was specifically trained for short sprints, which explains why his 20-second ergometer score is above that of the World Champion cyclist, trained for endurance events.
The figure also shows the power typically available from a male athlete for a given amount of time. The Snowbird’s required power is marked, along with the pilot’s maximum 20-second power measured on a cycling ergometer. The results show the poor efficiency of the low frequency rowing motion at such high power outputs. Studies early on in the project showed that the ideal pilot frequency for an output of 320 W was near 0.65 Hz, which subsequently formed the basis of the design, and resulted in a wing that was structurally tuned to perform at that specific frequency. Higher power outputs have correspondingly higher optimal frequencies, so unfortunately, the higher-than-predicted power of the Snowbird made the 0.65 Hz a non-optimal frequency for the pilot.
Stability and Control
Based on previous experience with the stability of ornithopters, the stability of the Snowbird was analyzed assuming it would perform in a similar fashion to an identical fixed wing aircraft with the same average dihedral. The aircraft was analyzed as if all deformations of the structure were quasi-steady. That is, it was assumed to be a rigid aircraft, but with the stability derivatives modified to take into account the steady-state bending and twisting deformation of the wing.
More extensive methods of analysis were presented by Drela, but were not employed due to time considerations. Because of the similarity in the designs of the Snowbird and the Daedalus, the team was confident that with a similar average dihedral and control surface sizes, the aircraft would be controllable.
Both the horizontal and vertical stabilizers are all moving surfaces hinged about the aerodynamic centre and actuated by standard hobby servos. The aircraft has no ailerons and turns are made with the rudder and appropriately designed yaw-roll coupling. The control response was found to be typical of human-powered aircraft, being extremely slow to turn because of the excessively large moments of inertia. The centre of mass was set such that the tail had zero lift force, giving a small static margin, but one that was easily controllable given the generally slow movements of the aircraft.
Mass Breakdown
The mass of the every component of the aircraft was meticulously measured during construction. A breakdown of the mass distribution is given below. Roughly 60% of the wing’s weight is the primary structure, with the secondary structure of ribs, leading-edge sheeting and covering making up the remaining 40%. The tail surfaces contribute a relatively small 5.6%, compared with the fuselage, 32.8%, and the wing, 61.6%. In total, the weight of the aircraft is only 63% of the pilot weight.
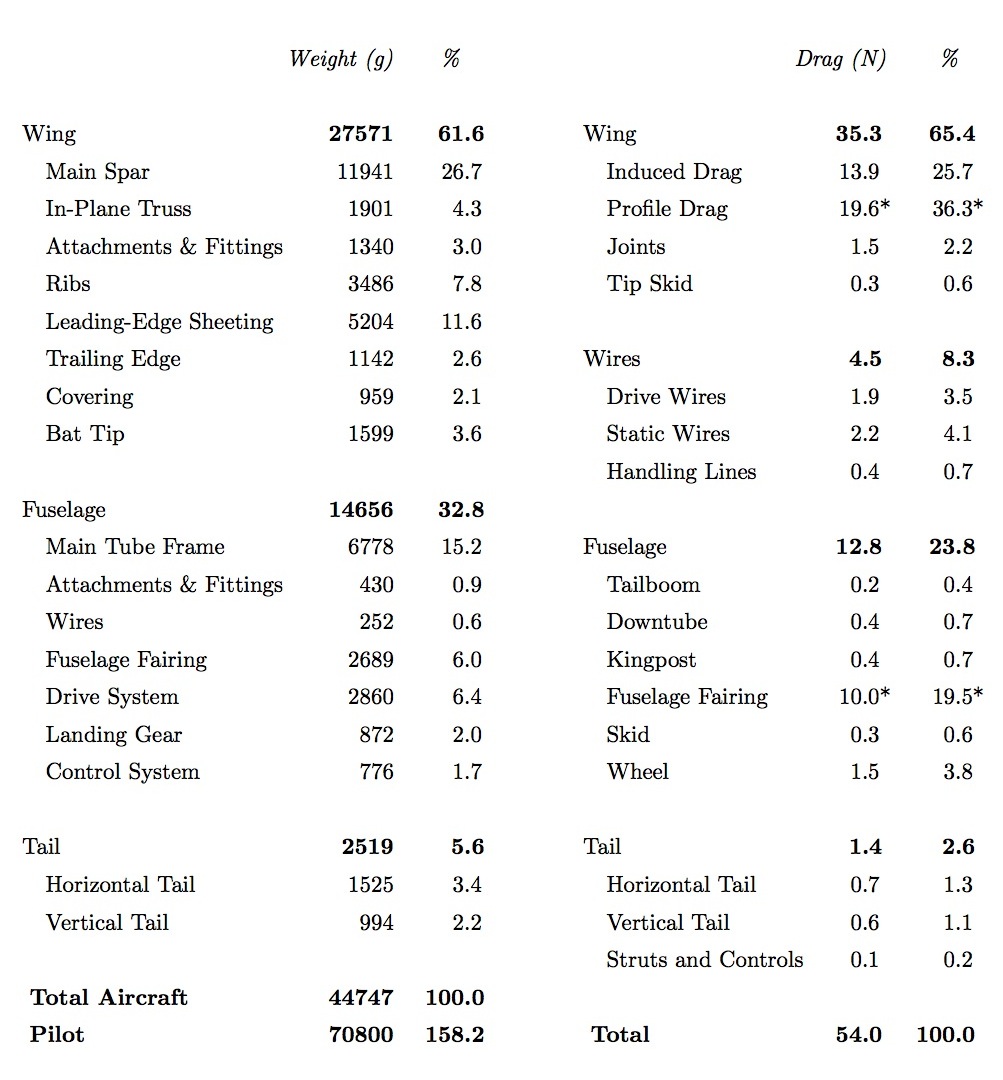
Mass and drag breakdown of the Snowbird. The proportions of the two largest drag contributors, marked with a “*” are rough estimates based on available data.
Drag Breakdown
The drag of most of the aerodynamic surfaces, wires and frame elements could be easily estimated from analytic formulas and 2D airfoil simulations in XFOIL. The total drag was measured through both glide testing and tow testing with a fish scale, however, the relative proportions of the two largest suspected drag contributors, wing profile drag and the drag of the fuselage fairing, remains unknown. It is likely that premature boundary layer transition substantially increased the profile drag of the wing. It is also possible that the damaged fuselage fairing in addition to a small sideslip angle, caused by a slight asymmetry in the twist of the wings, caused flow separation over parts of the shell. The best estimate of the drag breakdown of the aircraft is given in the table above.
Record Flight
To achieve flight, the Snowbird is first towed into the air by car. Upon release, the goal was to maintain both altitude and airspeed for as long as possible. Throughout October of 2009, and July and August of 2010, a total of 16 ground-handling tests and 52 flight test were performed, during which the airframe, the controls and the pilot’s skills were all improved. Of the 52 test flights, 38 included an attempt at flapping and 8 recorded brief moments of sustained flight. The following figure shows the flight data from the aircraft’s best performance, recorded on August 2nd, 2010 at 6:35am, where both altitude and airspeed were maintained for 19.3 seconds. Speed data was acquired with an onboard GPS flight data recorder; elevation data was acquired from a ground survey, and altitude data was acquired with a video camera set up specifically for that purpose.
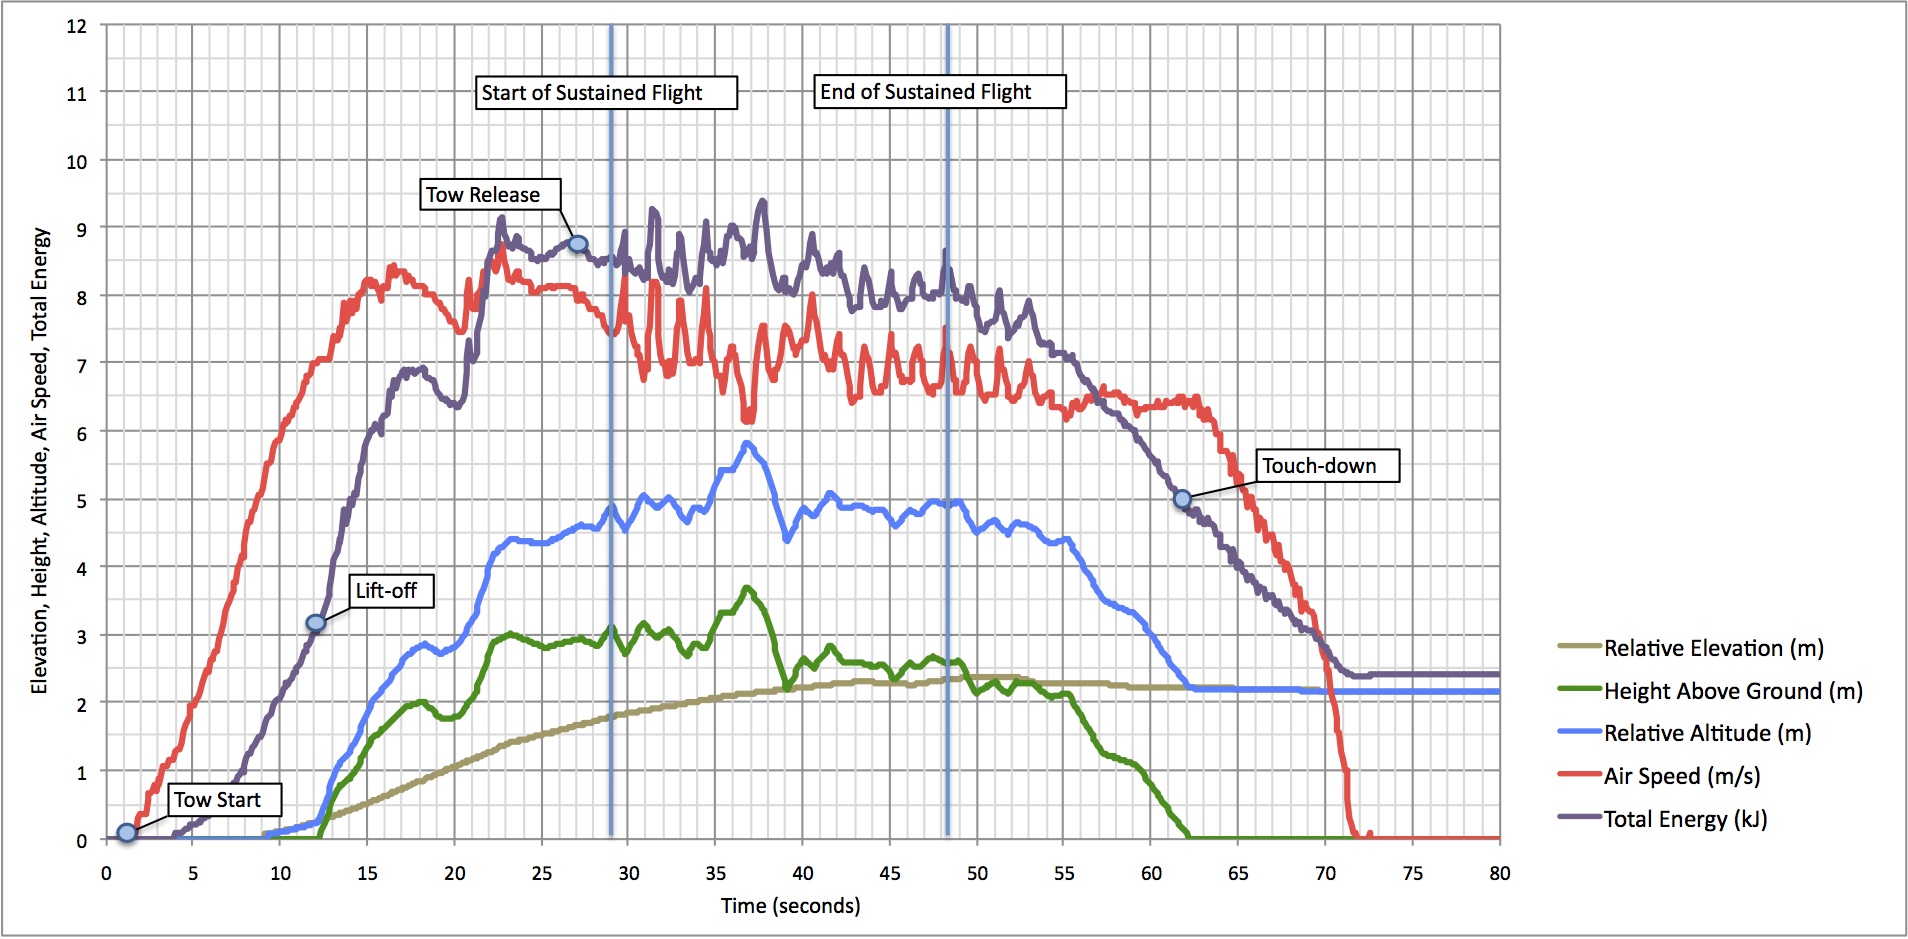
Analysis of record flight on August 2nd, 2010, with speed data recorded from the onboard GPS, surveyed elevation data, and altitude data pulled from side-view flight video.